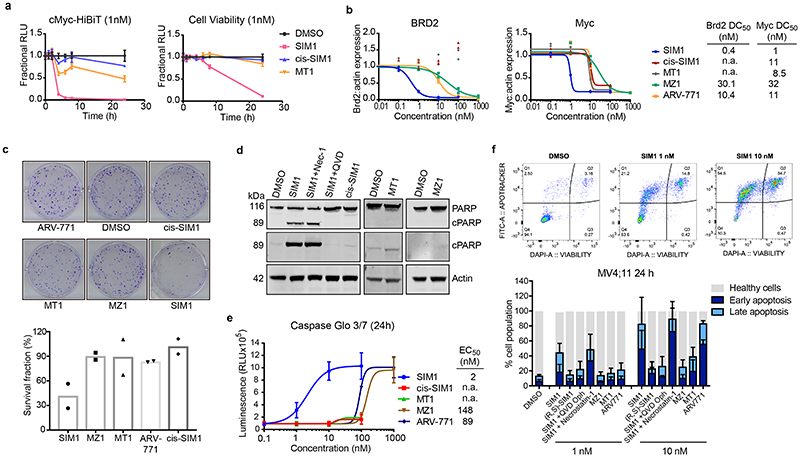
Figure 3. Potent SIM1 results in more efficacious apoptosis-induced cytotoxicity in BET-sensitive cancer cell lines.
a) Loss in CRISPR cMyc-HiBiT protein levels and correlative cell viability in MV4;11 cells treated with 1nM concentration of the indicated compounds. Luminescence and cell viability by CellTiter-Glo were measured at various time points over 24h. Data are presented as mean values with error bars representing the SD of technical quadruplicates. b) Quantified expression levels of endogenous BRD2 and Myc in 22Rv1 prostate cancer cell line treated with compounds for 4h. Curves are a best fit of means from two biologically independent experiments. Corresponding blots are in Extended Data Fig. 3b, and full blots are supplied as Source Extended Data Fig. 3. c) Survival of 22Rv1 cells in clonogenic assay. Cells were treated with 10nM compounds for 24h. Five hundred cells were re-plated and allowed to grow at 37°C for 20 days before scanning. Survival fraction was determined by dividing plating efficiency of treated cells by plating efficiency of untreated cells. d) Immunoblot of PARP-cleavage in 22Rv1 cells with indicated compounds at 10nM for 24h with or without the addition of caspase inhibitor (QVD-OPh, 20μM) or necroptosis inhibitor (Necrostatin-1, 20μM). Blots for 48h treatments and 1μM MZ1 and MT1 treatments are in Extended Data Fig. 4a-b. Full blots are supplied as Source Data Fig. 3. e) Caspase-Glo 3/7 assays treated with compounds or DMSO for 24h in 22Rv1 cells. Curves are a best fit of means from three biologically independent experiments, ±s.e.m. f) Percentage of early (FITC: Apotracker Green) and late (FITC: Apotracker Green and DAPI) apoptotic and healthy MV4;11 cells after treatment with test compounds at the indicated concentrations for 24h, as analysed by Apotracker Green and DAPI staining for viability and surface presence of phosphatidyl serine, respectively, and flow cytometry analysis. Data are plotted as stacked bars so single dots are not shown. Error bars reflect a mean ± s.d. of three biological replicates. Representative data for DMSO, SIM1 1nM and 10nM are shown (top), displayed as raw dot-plot analysed by FlowJo. Raw plots for all representative treatments are in Extended Data Fig. 5.

