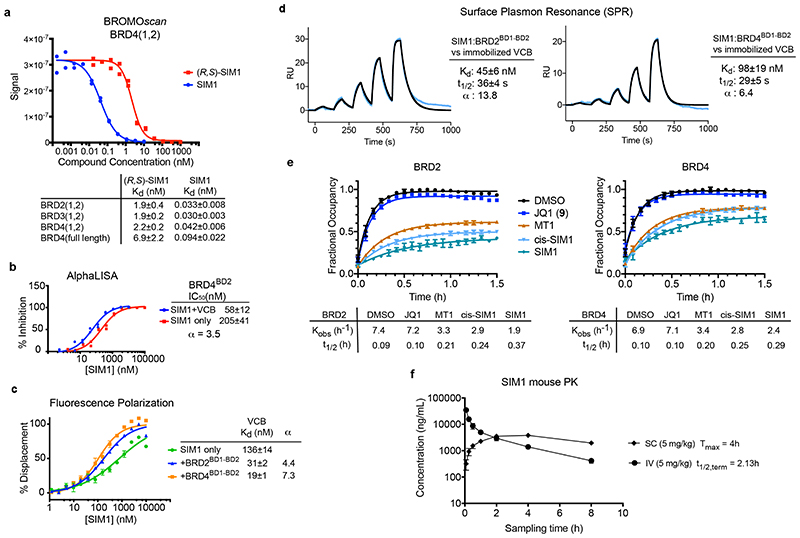
Figure 5. SIM1 forms cooperative stable ternary complexes with enhanced cellular residence time and shows favourable pharmacokinetic profile in mice.
BROMOscan displacement titrations by SIM1 and (R,S)-SIM1 from BRD4(1,2). The amount of bromodomain protein measured by qPCR (Signal; y-axis) is plotted against the corresponding compound concentration in log10 scale (nM, x-axis). Dissociation constants Kd from curve fitting are tabulated. Error values are generated by the GraphPad Prism program and reflect the quality of the fit between the nonlinear least-squares curve and the experimental data. b) AlphaLISA titrations of SIM1 in duplicates against biotin-JQ1:BRD4BD2 in the absence (red) or presence (blue) of VCB protein. IC50 values from curve fitting are tabulated, together with the resulting cooperativity α. Error values are generated by the GraphPad Prism program and reflect the quality of the fit between the nonlinear least-squares curve and the experimental data. c) Fitted curves from FP competition assays measuring displacement of a FAM-labelled HIF-1α peptide from VCB by SIM1 titrated in triplicates, in the presence or absence of tandem BD1-BD2 proteins from BRD2 or BRD4. Kd values from curve fitting are tabulated, together with the resulting cooperativity α. d) SPR sensograms to monitor in real-time the interaction of binary complexes SIM1:BRD2(1,2) and SIM1:BRD4(1,2) with immobilized biotin-VCB protein. Sensorgrams shown are for a ternary single-cycle kinetic (SCK) experiments as representative to at least three independent experiments. Values shown are mean ± s.d. from the data fitting of each replicate. Cooperativity α is calculated using dissociation constant K d of SIM1 binary binding to VCB (Extended Data Fig. 7a). Multiple-cycle kinetic (MCK) ternary data are also shown in Extended Data Fig. 7a. e) Live cell kinetic residence time experiments with BRD2 and BRD4 as measured by NanoBRET target engagement. CRISPR HiBiT-BRD2 or HiBiT-BRD4 cells were incubated with each of the indicated compounds at their pre-determined EC80 values (listed in Methods) followed by addition of a competitive fluorescently-labeled BET tracer. NanoBRET was measured and is plotted as fractional occupancy over time. From these graphs, residence time rates (Kobs (h-1) and half-life (t½ (h)) were determined. Data are presented as mean values with error bars representing the SD of technical triplicates. f) SIM1 exhibits excellent availability and pharmacokinetics exposure in vivo. Mean plasma concentration-time profiles of SIM1 after single intravenous (IV) or subcutaneous (SC) administration (5 mg/kg) to male C57BL/6 mice (n =3) are shown. Further details are in the associated Supplementary Table 2 and Supplementary Data Set 2.

