Figure 4.
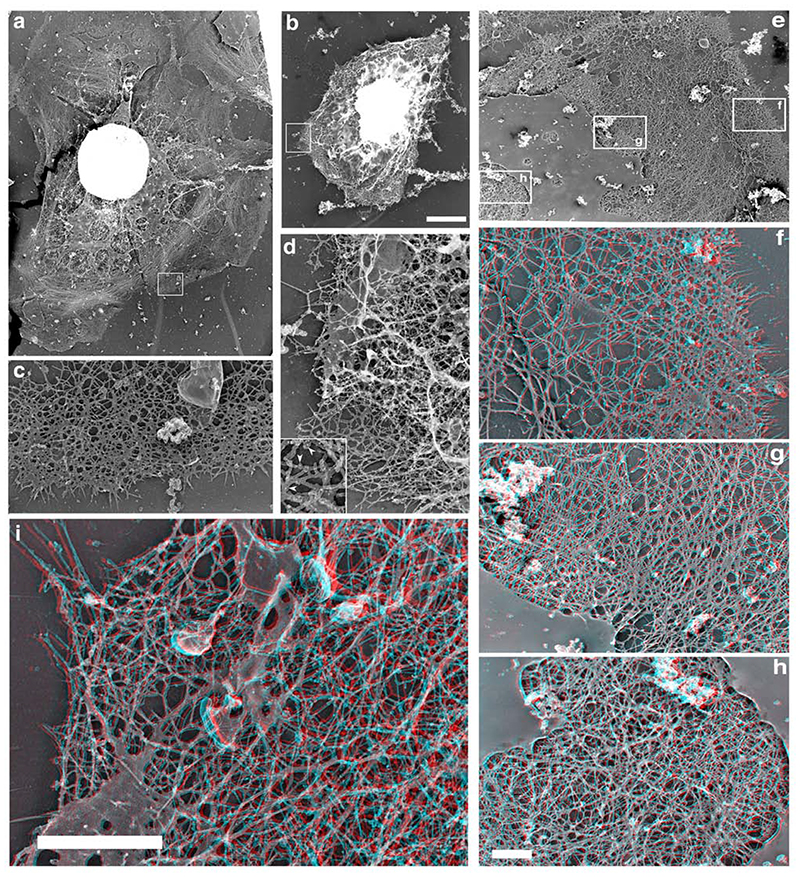
Scar microinjection alters both the structure and the depth of the actin network at the leading edge. Resting MTLn3 cells were microinjected with Scar-WA domain and processed for rapid freeze/freeze dry and rotary shadowing to generate metal replicas. 3 dimensional red/blue views of the cytoskeleton were reconstructed from stereo pairs (f-i; proper viewing of these images require red/blue 3D glasses). a, c, e-h: control cells; b, d, i: Scar-WA injected cells. Control resting cells display broad lamellipods (a) with a typical dendritic-like network at the leading edge (c). The leading edge network is mostly a 2 dimensional array of filaments with a few filaments pointing upwards (e, f). After a relatively less dense of actin filaments, the network further inside becomes profoundly denser, mostly by building different layers in depth (g). The perinuclear actin network is extremely dense and multilayered (h). Scar-WA injected cells display a complete reorganisation of the actin network at the periphery (b, d, i). These cells fail to display any typical dendritic network at the periphery (d), but show a poorly organised dense network of actin, which is a multilayered 3D structure,, (i) similar to that normally found in the perinuclear region of resting cells (d). Inset, enlargement showing the 5 nm gold label on the filaments that allowed for identification of the microinjected cells (see Material and methods). Bars: a-d: bar= 2 um (a, b) and 0.5 um (c, d); e-h: bar= 2um (e) and 0.5 um (f-h); i: bar =1 um

