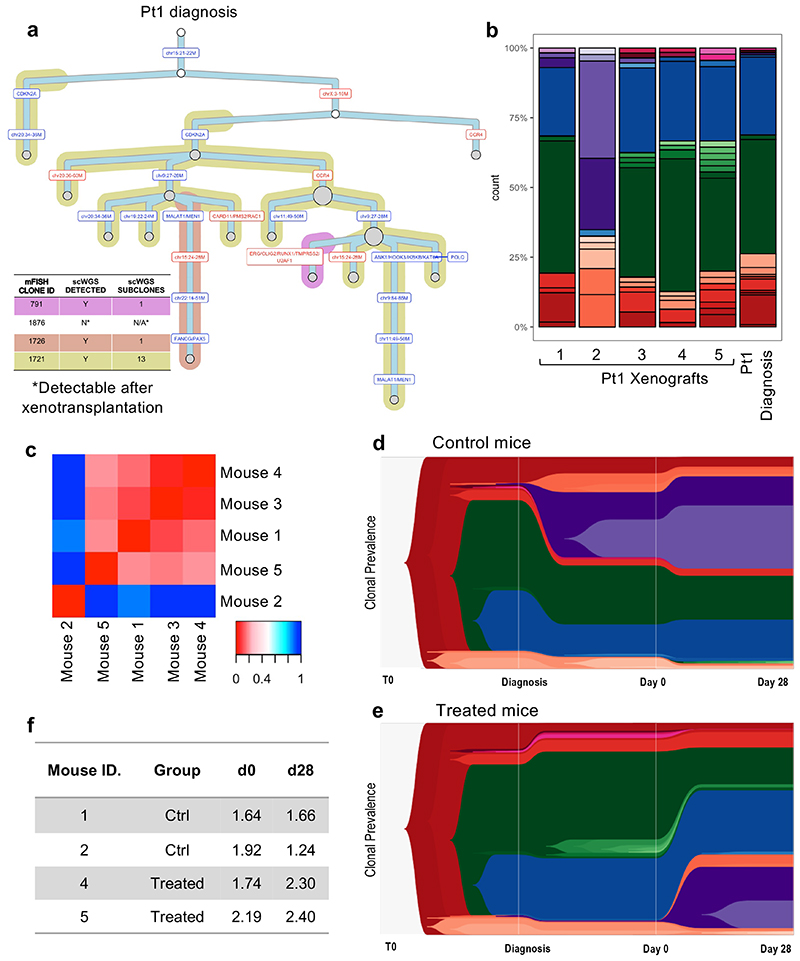
Figure 4. Single-cell whole-genome sequencing confirms limited selection of genetic subclones in response to chemotherapy.
(a) Phylogenetic tree of Pt1 diagnostic leukemia as inferred by scWGS. Background shading is used to highlight clones previously defined by mFISH. (b) Subclonal genetic composition of 5 mice engrafted with Pt1 leukemia at d0 (before treatment) and Pt1 diagnostic disease (c) Heatmap showing all Jensen-Shannon divergence index-based comparisons of clonal compositions between pairs of engrafted mice at d0. (d-e). TimeScape plots visualizing tumor evolution over time in 2 control (grouped) and 2 treated (grouped) mice. The plots show the clonal composition at 3 timepoints: i) the primary diagnostic leukemia ii) at d0 in the xenografts (BM aspirate), and ii) at d28 in the xenografts (total BM harvest). Clonal identities as detailed in Figure S4C. (f) Table summarizing the Shannon entropy values of each control and treated engrafted leukemia at d0 and d28.

