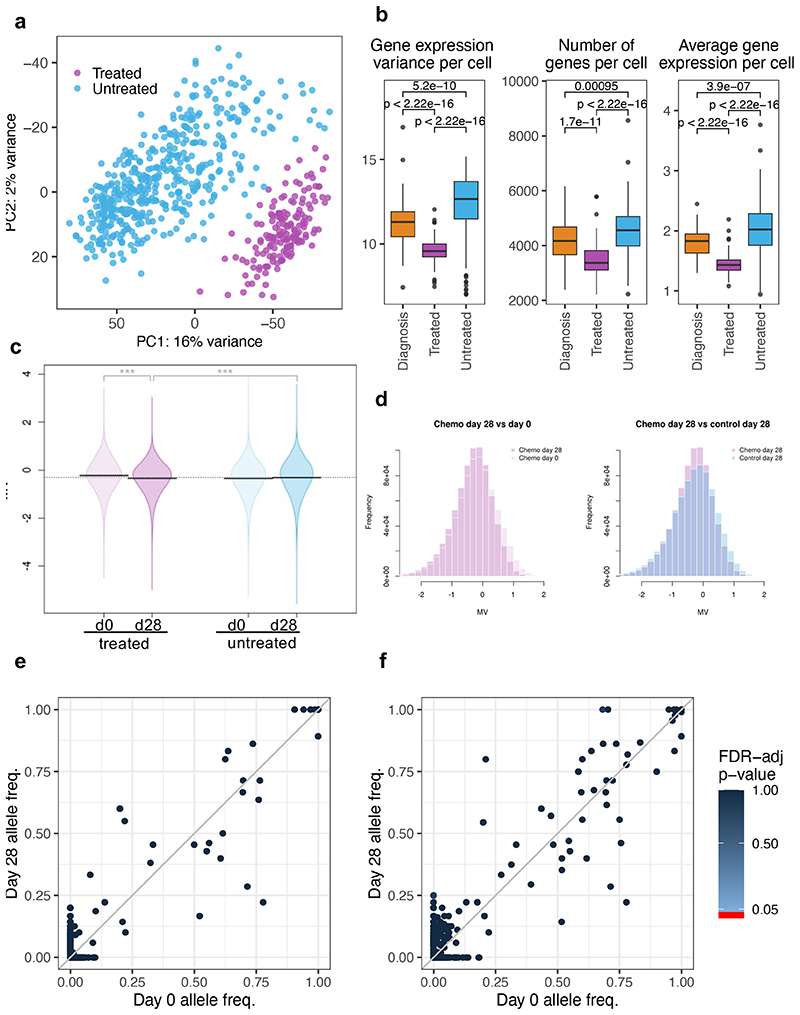
Figure 6. Transcriptional and epigenetic variability provide a substrate for genotype-independent selection over treatment.
Single-cell RNA sequencing of d0 (BM aspiration) and d28 (total BM harvest), primary cells from 3 untreated and 4 treated Pt1 xenografts. Untreated cells (light blue) comprise d0 and d28 cells from control mice and d0 cells (engrafted before to treatment) from treated mice. Treated cells (purple) are d28 cells from mice that received chemotherapy. (a) Principal component analysis of the single-cell data displaying variations in the transcriptomes of individual untreated and treated cells. (b) Boxplots showing gene expression variance per cell (left), number of genes expressed per cell (middle), and average gene expression per cell (right) in diagnostic (n=448 cells), treated (n=163 cells) and untreated cells (n=66 cells). Data is normalized for sequencing coverage. Each boxplot shows the median, the 25th and the 75th percentiles; whiskers cover all data points within a 1.5x the inter-quantile range from the bounds of the box; remaining data points are plotted as outliers. Distributions are compared using a 2-sided Wilcoxon test (unadjusted p-values). (c) Violin plots showing mean methylation variance (MV) scores across n=763949 array probes for n=6 control and n=9 treated mice at d0 and d28. Statistical significance (2-sided T-test) is shown above each MV comparison. P-value statistical significance corresponds to: ***<1e-3 (d) Histogram representation of the MV scores for control and treated mice. (e) SNV analysis comparing the frequency of COSMIC mutations across cells in paired day 0 and d28 post-treatment samples. Only mutations supported by at least 10 reads in at least 10% of the cells were included in the analysis (total 813 COSMIC-annotated SNVs). No SNV was found to be significantly enriched (2-sided Fisher exact test, p-value < 0.05, FDR multiple-test correction). (f) Same as (e) but clustering mutations by gene (538 mutated genes in total).

