. 2021 Aug 20;81(21):5438–5450. doi: 10.1158/0008-5472.CAN-21-0613

Figure 3.

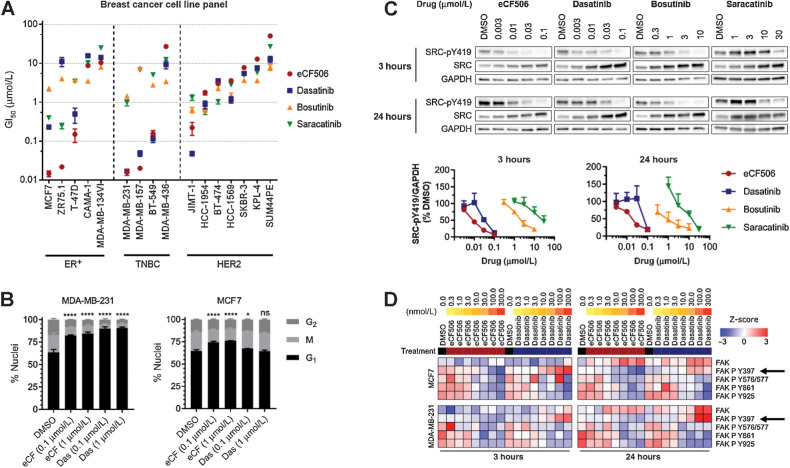
Figure 3. A, Antiproliferative activities of eCF506, dasatinib, bosutinib, and saracatinib across 16 breast cancer cell lines. Calculated GI50 values are ranked by sensitivity to eCF506. Error bars, ±SD (n = 3). B, Cell-cycle analysis after treating MDA-MB-231 and MCF7 cells with eCF506 or dasatinib for 48 hours. Error bars, ± SD (n = 3). Changes in G1 phase compared by one-way ANOVA (Dunnett correction for multiple comparison); *, P < 0.05; ****, P < 0.0001; ns, nonsignificant. C, Representative Western blots after treating MDA-MB-231 for 3 and 24 hours with eCF506, dasatinib, bosutinib, and saracatinib. Plots of normalized SRC-pY419 levels after each treatment are shown at the bottom. Error bars, ±SD (n = 3). D, Analysis of total and phosphorylated FAK from the RPPA study in MCF7 (top) and MDA-MB-231 (bottom) cells after 3 hours (left) and 24 hours (right) treatment with eCF506 and dasatinib at 0.3 to 300 nmol/L. Arrows, FAK-pY397.

A, Antiproliferative activities of eCF506, dasatinib, bosutinib, and saracatinib across 16 breast cancer cell lines. Calculated GI50 values are ranked by sensitivity to eCF506. Error bars, ±SD (n = 3). B, Cell-cycle analysis after treating MDA-MB-231 and MCF7 cells with eCF506 or dasatinib for 48 hours. Error bars, ± SD (n = 3). Changes in G1 phase compared by one-way ANOVA (Dunnett correction for multiple comparison); *, P < 0.05; ****, P < 0.0001; ns, nonsignificant. C, Representative Western blots after treating MDA-MB-231 for 3 and 24 hours with eCF506, dasatinib, bosutinib, and saracatinib. Plots of normalized SRC-pY419 levels after each treatment are shown at the bottom. Error bars, ±SD (n = 3). D, Analysis of total and phosphorylated FAK from the RPPA study in MCF7 (top) and MDA-MB-231 (bottom) cells after 3 hours (left) and 24 hours (right) treatment with eCF506 and dasatinib at 0.3 to 300 nmol/L. Arrows, FAK-pY397.