. 2021 Jun 8;11(11):2924–2943. doi: 10.1158/2159-8290.CD-20-1378

Figure 4.

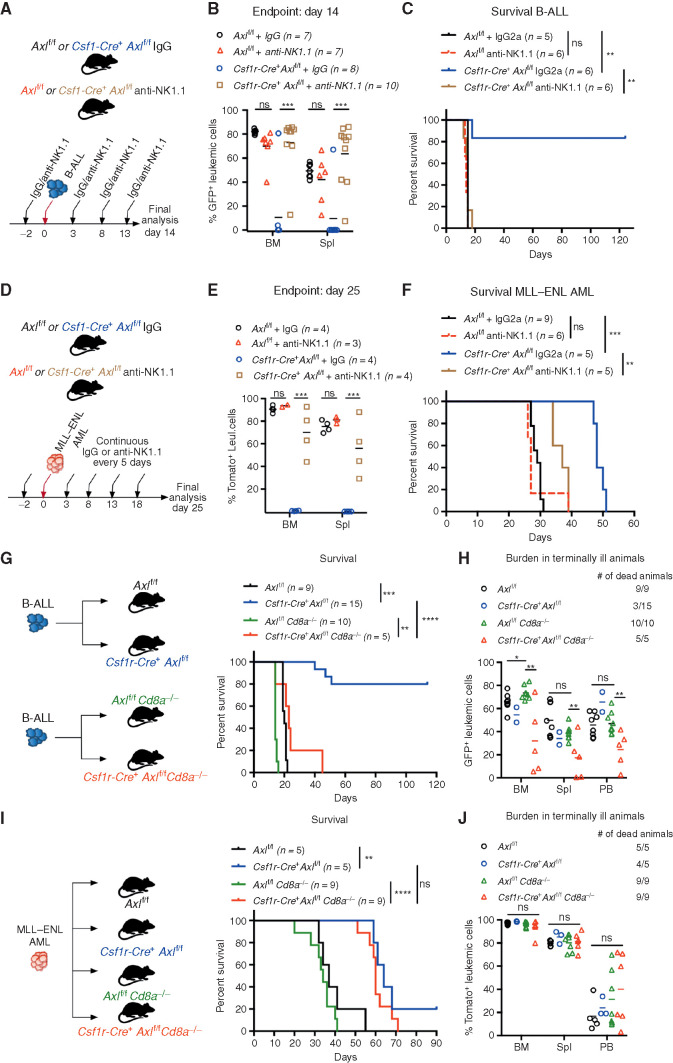
Figure 4. Axl-deficient macrophages trigger a robust NK-cell and T-cell immune response that suppresses leukemia. A and B, Axlf/f and Csf1r-Cre+ Axlf/f mice were challenged with 103 B-ALL cells and treated with either an anti-NK1.1 antibody or a mouse IgG2a isotype control (50 μg/mouse) every 5 days as indicated. Leukemic burden (% GFP+) in the bone marrow and spleen on day 14 is depicted (B). ns, not significant. ***, P < 0.001, unpaired two-tailed Student t test. C, Kaplan–Meier survival analysis of mice of the indicated genotypes challenged with 103 B-ALL cells and treated as in A. Treatments stopped once all anti-NK1.1–treated mice were dead. ns, not significant. **, P < 0.01, log-rank (Mantel–Cox) test. D and E, Same as in A and B using 105 MLL–ENL AML cells. Leukemic burden (% Tomato+) on day 25 is depicted. ns, not significant. **, P < 0.01; ***, P < 0.001, unpaired two-tailed Student t test. F, Kaplan–Meier survival analysis of mice of the indicated genotypes challenged with 105 MLL–ENL AML cells and treated as in D. Treatments stopped once all anti-NK1.1–treated mice were dead. ns, not significant. **, P < 0.01; ***, P < 0.001, log-rank (Mantel–Cox) test. G, Kaplan-Meier survival analysis of mice of the indicated genotypes challenged with 103 B-ALL cells. Data are pooled from two independent experiments as indicated in the scheme. **, P < 0.01; ***, P < 0.001; ****, P < 0.0001, log-rank (Mantel–Cox) test. H, Leukemic burden (% GFP+) in all terminally ill animals that could be analyzed from G. Note that burden from animals found dead cannot be depicted. ns, not significant. *, P < 0.05; **, P < 0.01, unpaired two-tailed Student t test. I, Kaplan–Meier survival curve of mice of the indicated genotypes challenged with 105 MLL–ENL cells. Survival of the reference groups (Axlf/f and Csf1r-Cre+ Axlf/f) is also depicted in Fig. 2I. ns, not significant. **, P < 0.01; ***, P < 0.001, log-rank (Mantel–Cox) test. J, Leukemic burden (% tomato+) in all terminally ill animals that could be analyzed from I. Note that burden from animals found dead cannot be depicted. ns, not significant, unpaired two-tailed Student t test.

Axl-deficient macrophages trigger a robust NK-cell and T-cell immune response that suppresses leukemia. A and B,Axlf/f and Csf1r-Cre+ Axlf/f mice were challenged with 103 B-ALL cells and treated with either an anti-NK1.1 antibody or a mouse IgG2a isotype control (50 μg/mouse) every 5 days as indicated. Leukemic burden (% GFP+) in the bone marrow and spleen on day 14 is depicted (B). ns, not significant. ***, P < 0.001, unpaired two-tailed Student t test. C, Kaplan–Meier survival analysis of mice of the indicated genotypes challenged with 103 B-ALL cells and treated as in A. Treatments stopped once all anti-NK1.1–treated mice were dead. ns, not significant. **, P < 0.01, log-rank (Mantel–Cox) test. D and E, Same as in A and B using 105MLL–ENL AML cells. Leukemic burden (% Tomato+) on day 25 is depicted. ns, not significant. **, P < 0.01; ***, P < 0.001, unpaired two-tailed Student t test. F, Kaplan–Meier survival analysis of mice of the indicated genotypes challenged with 105MLL–ENL AML cells and treated as in D. Treatments stopped once all anti-NK1.1–treated mice were dead. ns, not significant. **, P < 0.01; ***, P < 0.001, log-rank (Mantel–Cox) test. G, Kaplan-Meier survival analysis of mice of the indicated genotypes challenged with 103 B-ALL cells. Data are pooled from two independent experiments as indicated in the scheme. **, P < 0.01; ***, P < 0.001; ****, P < 0.0001, log-rank (Mantel–Cox) test. H, Leukemic burden (% GFP+) in all terminally ill animals that could be analyzed from G. Note that burden from animals found dead cannot be depicted. ns, not significant. *, P < 0.05; **, P < 0.01, unpaired two-tailed Student t test. I, Kaplan–Meier survival curve of mice of the indicated genotypes challenged with 105 MLL–ENL cells. Survival of the reference groups (Axlf/f and Csf1r-Cre+ Axlf/f) is also depicted in Fig. 2I. ns, not significant. **, P < 0.01; ***, P < 0.001, log-rank (Mantel–Cox) test. J, Leukemic burden (% tomato+) in all terminally ill animals that could be analyzed from I. Note that burden from animals found dead cannot be depicted. ns, not significant, unpaired two-tailed Student t test.