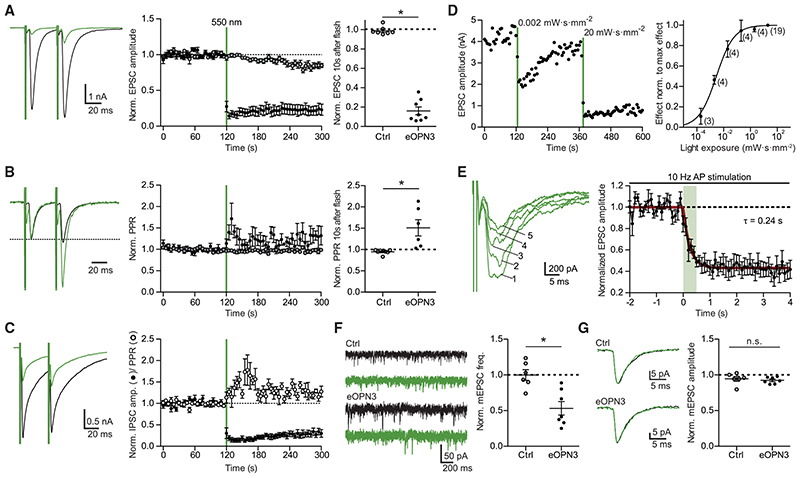
Figure 2. Light-induced inhibition of neurotransmitter release in autaptic hippocampal neurons expressing eOPN3.
(A) Typical autaptic EPSCs evoked by a pair of 1 ms depolarizing current injections (40 ms inter-stimulus interval, injected currents clipped for presentation) before (black) and after (green) illumination with 550 nm light (40 mW-mm−2, unless otherwise indicated). Traces are averages of 6 sweeps. A 500 ms light pulse caused sustained suppression of EPSCs in eOPN3-expressing neurons. EPSCs decreased to 16 ± 4% of baseline (n = 8), while EPSCs in control neurons were not affected by illumination (open circles, n = 7, p = 3·10−4 two-tailed Mann-Whitney test).
(B) Traces from (A) scaled to the amplitude of the first EPSC (dashed line). Illumination increased the paired-pulse ratio (EPSC2/EPSC1) in the eOPN3-positive neurons (n = 6) compared to controls (p = 1.2-10−3 unpaired, two-tailed Student’s t test).
(C) Amplitudes and PPR of evoked autaptic IPSCs in GABAergic neurons, compared to the pre-light baseline (IPSCs: n = 7; PPR: n = 5).
(D) Quantification of light exposure required for half maximal synaptic inhibition. Normalized effect size was fit as a sigmoidal dose-response curve (n is reported next to the measurement points, EC50 = 2.895 mW-s-mm−2).
(E) Time-course of the eOPN3 activation on EPSC amplitudes evoked by APs triggered at 10 Hz. Traces show five consecutive EPSCs of the train following the onset of a single 500 ms light pulse. EPSCs decreased with a time constant ton of 240 ms (n = 6).
(F) Representative traces of mEPSCs (left) and quantification (right). eOPN3 activation decreased mEPSC frequency to 53 ± 9% compared to baseline (n = 7), significantly different from controls (n = 6, p = 3·10−3, two-tailed Mann-Whitney test).
(G) Quantal EPSC amplitude in eOPN3-expressing and control neurons after illumination (p = 0.3 unpaired, two-tailed Student’s t test). Plots show individual data points and average (black) ± SEM.

