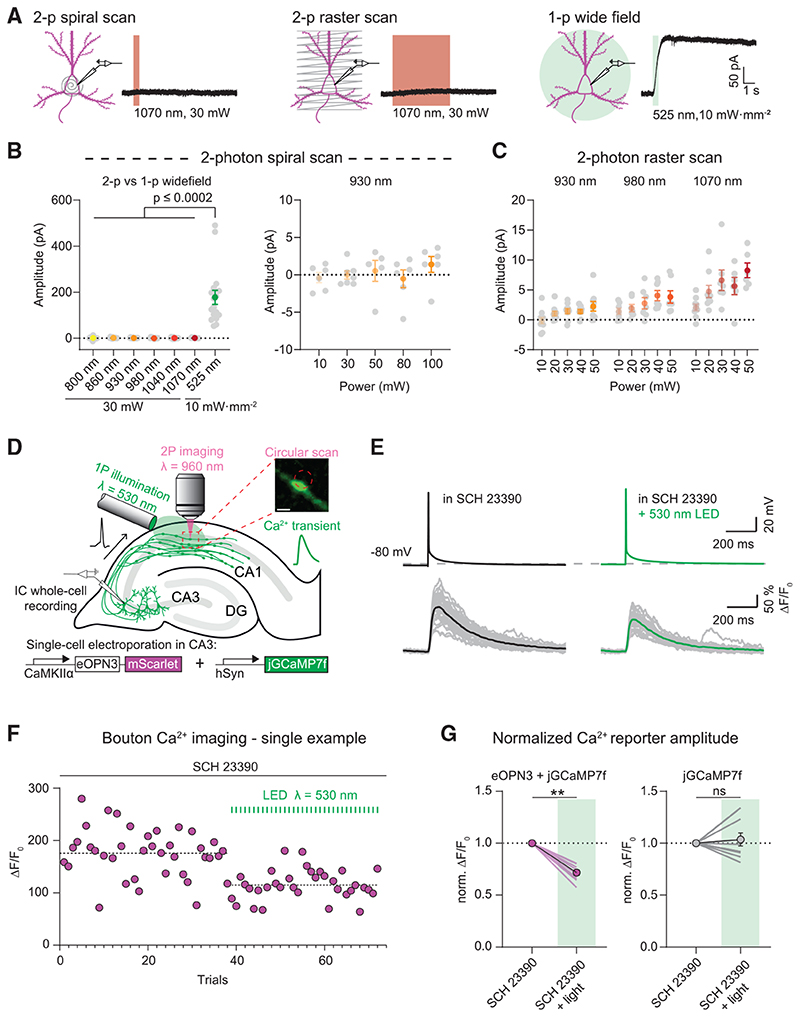
Figure 5. eOPN3 two-photon activation properties and modulation of presynaptic voltage-gated Ca2+ channels.
(A) Two-photon (left, middle) versus single-photon (right) activation of eOPN3 in CA3 pyramidal neurons in organotypic hippocampal slice cultures expressing eOPN3-mScarlet and GIRK2-1. Somatic 500 Hz spiral scans (2 ms/spiral, 250 cycles, 500 ms total duration) or raster scans (FOV = 106*106 μm, 512x512 pixels, 1.8 ms/line, 5 frames, 4.6 s total duration) at 1.09 Hz over the somatodendritic compartment were used for two-photon activation characterization. Example voltage-clamp traces show photocurrents obtained by the different stimulation modalities in the same cell.
(B) Quantification of the photocurrents elicited by two-photon versus single-photon illumination. Left: GIRK-mediated currents in eOPN3 expressing neurons stimulated with two-photon spiral scanning at wavelengths from 800 nm to 1070 nm at 30 mW, or with full-field 525 nm light (Kruskal-Wallis test, Dunn’s multiple comparisons test). Right: Increasing laser intensity during spiral scans at930 nm did not result in significant photocurrent.
(C) Slower and longer raster scanning over a larger field of view resulted in minimal outward currents and was wavelength and laser-intensity dependent (Linear regression indicated positive slopes. Bonferroni-Holm corrected p values: wavelength: p = 6.1·10−4; laser power: 930 nm: p = 0.01; 980 nm: p = 7.2·10−3; 1070 nm: p = 1.2·10−3).
(D) Schematic diagram of presynaptic Ca2+ imaging experiments (see STAR Methods for details). Inset shows a single-plane jGCaMP7f image of an en passant bouton and the circular imaginglaser scanning path (red dashed circle, scale bar, 1 μm). A fiber-coupled LED was used to locally activate eOPN3 in CA1 the presence of the GIRK channel blocker SCH 23390.
(E) Top: representative voltage traces of electrically evoked APs in a transfected CA3 pyramidal neuron in the dark and after a green light pulse (dashed line shows the resting membrane potential at the beginning of the experiment). Bottom: corresponding Ca2+ responses from a presynaptic bouton. Single trials are shown in gray; black and green traces represent the averaged responses before and after light, respectively.
(F) Peak jGCaMP7f transients in the dark and after green light pulses in a single experiment, indicating a light-dependent decrease in presynaptic Ca2+ influx. Dashed lines show the average for the two conditions.
(G) Quantification of normalized eOPN3-jGCaMP7f transients (left) (SCH 23390 + light = 0.72 ± 0.026, p = 2.10_3, Wilcoxon-test, n = 10 slices) and jGCaMP7f alone (right) (SCH 23390 + light = 1.04 ± 0.06, p = 0.89, paired t test, n = 10 slices). Plots show individual data points (lines), and average (circles) ± SEM.

