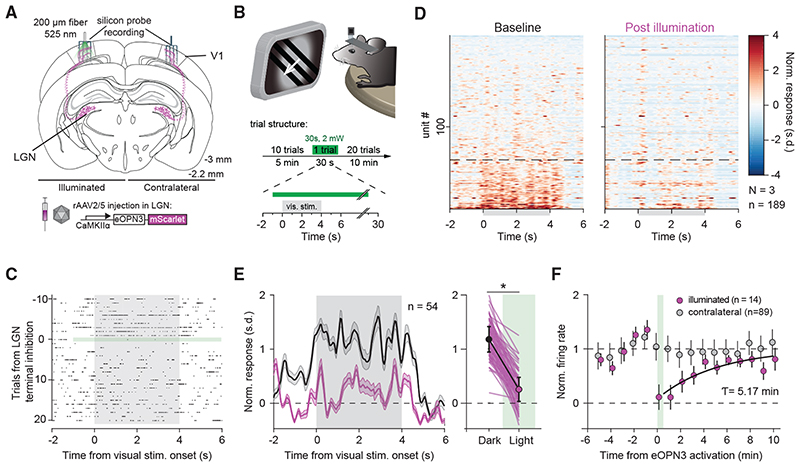
Figure 6. eOPN3 mediated suppression of thalamocortical inputs in awake head-fixed mice.
(A) Schematic diagram of the investigated circuit. Lateral geniculate nucleus (LGN) neurons were bilaterally transduced with eOPN3. Acute silicon probe recordings were performed bilaterally in primary visual cortex (V1) before and after unilateral illumination of LGN terminals in V1.
(B) During recordings, head-fixed mice were presented with a compound drifting grating stimulus (4 s duration) every 30 s for 21 trials (top). Ten baseline trials were followed by a single trial paired with 30 s of light delivery (525 nm at ~2 mW from a 200 mm, 0.5 NA optical fiber) to V1, and 20 post-light trials.
(C) Raster plot of a representative V1 unit with reduced firing rate induced by eOPN3 activation.
(D) Heat plot of the population response to visual stimulus presentation of all recorded units (189 units from 3 mice) on the hemisphere of eOPN3 activation before (left) and after (right) eOPN3 activation. Units were sorted by their response magnitude to visual stimulus presentation during baseline condition. Units below the dashed line (n = 54) show a positive average response during the 4 s visual stimulus presentation.
(E) Left: Average peristimulus time histogram of the visual stimulus responsive units (below dashed line in D). Each unit’s activity was normalized to the average firing rate in the 15 s prior to stimulus presentation during the two trials before eOPN3 activation. Right: Quantification of the average response during 4 s visual stimulus presentation in the two trials before (Dark) and first two trials after eOPN3 activation onset (Light). Dark: 1.17 ± 0.23, Light: 0.25 ± 0.22, p < 1 o 10_3, Wilcoxon test, n = 54 units. Plot shows individual units (lines), and population average (circles) ± SEM.
(F) Kinetics of the recovery of visual stimulus response amplitude for units that showed a reduction >50% in their visual stimulus response (magenta), fitted with a mono-exponential function (black line). Units recorded simultaneously from the contralateral hemisphere (gray) did not change their response following ipsilateral eOPN3 activation. During the baseline and post light period, the plot shows the averages of two consecutive trials (circles) ± SEM.

