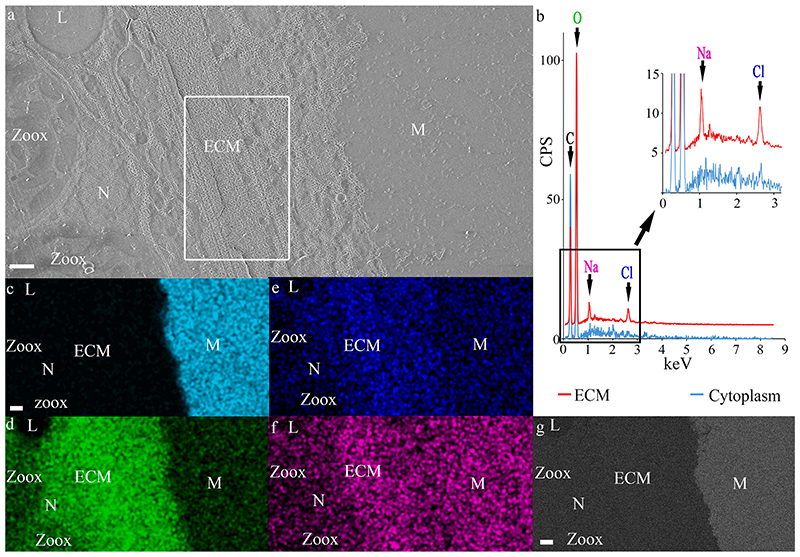
Fig. 8. Cryo-SEM/EDS analysis of the ECM.
(a) SE mode micrograph of the tissue–mineral interface. (b) Cryo-EDS spectra of the ECM (measured area is marked with a white rectangle in (a)) and of the cytoplasm in a calicoblastic cell. Identified elements are labeled in the graph. (c)-(f) Cryo-EDS elemental distribution maps of the same area as in image (a): of the elements: Calcium (Cyan), oxygen (Green), chlorine (Blue), and sodium (Magenta). (g) Cryo-EsB micrograph of the same area as in (a)-(f). All scale bars are 1 μm. M = Mineral, N = Nucleolus, Zoox = algal symbiont, L = Lipid body. CSP = counts per second.

