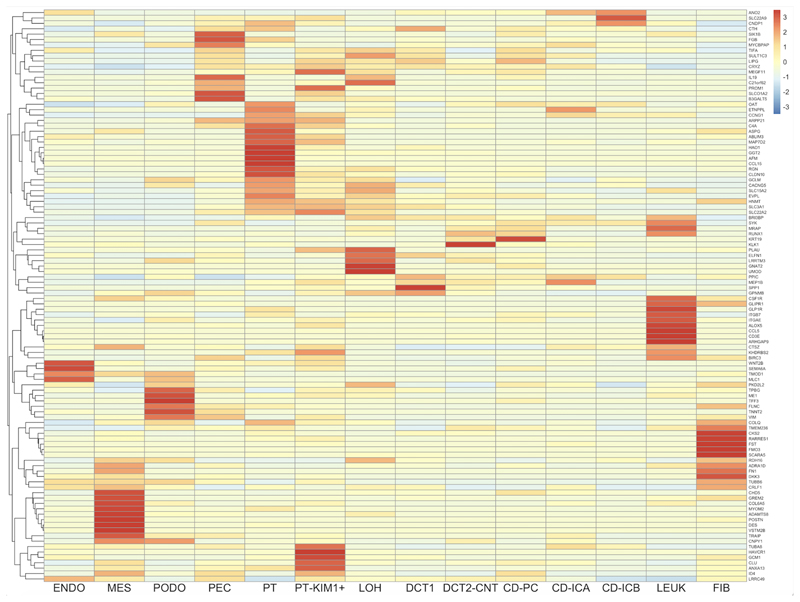
Figure 1. Deconvolution analysis of 106 DKD-associated transcripts which are corrected by RYGB in ZDF rats using publicly available human diabetic kidney single-cell RNA-sequencing data.
Columns represent 14 kidney cell types. Cell types include: ENDO, endothelial cells; MES, mesangial cells; PODO, podocytes; PEC, parietal epithelial cells; PT, proximal tubular cells; PT-KIM1+, proximal tubular cell cluster positive for kidney-injury molecule-1; LOH, loop of Henle; DCT1, distal convoluted tubule cluster 1; DCT2-CNT, distal convoluted tubule cluster 2-connecting tubule; CD-PC, collecting duct-principal cell; CD-ICA, collecting duct-intercalated cell type A; CD-ICB, collecting duct-intercalated cell type B; LEUK, leukocyte; FIB, fibroblast.
Rows indicate genes (official gene symbols of human orthologous genes displayed).
Cell colours indicate relative transcript expression levels in the human diabetic kidney: red – high expression in cell type; yellow – low expression in cell type; blue – very low/absent expression in cell type.

