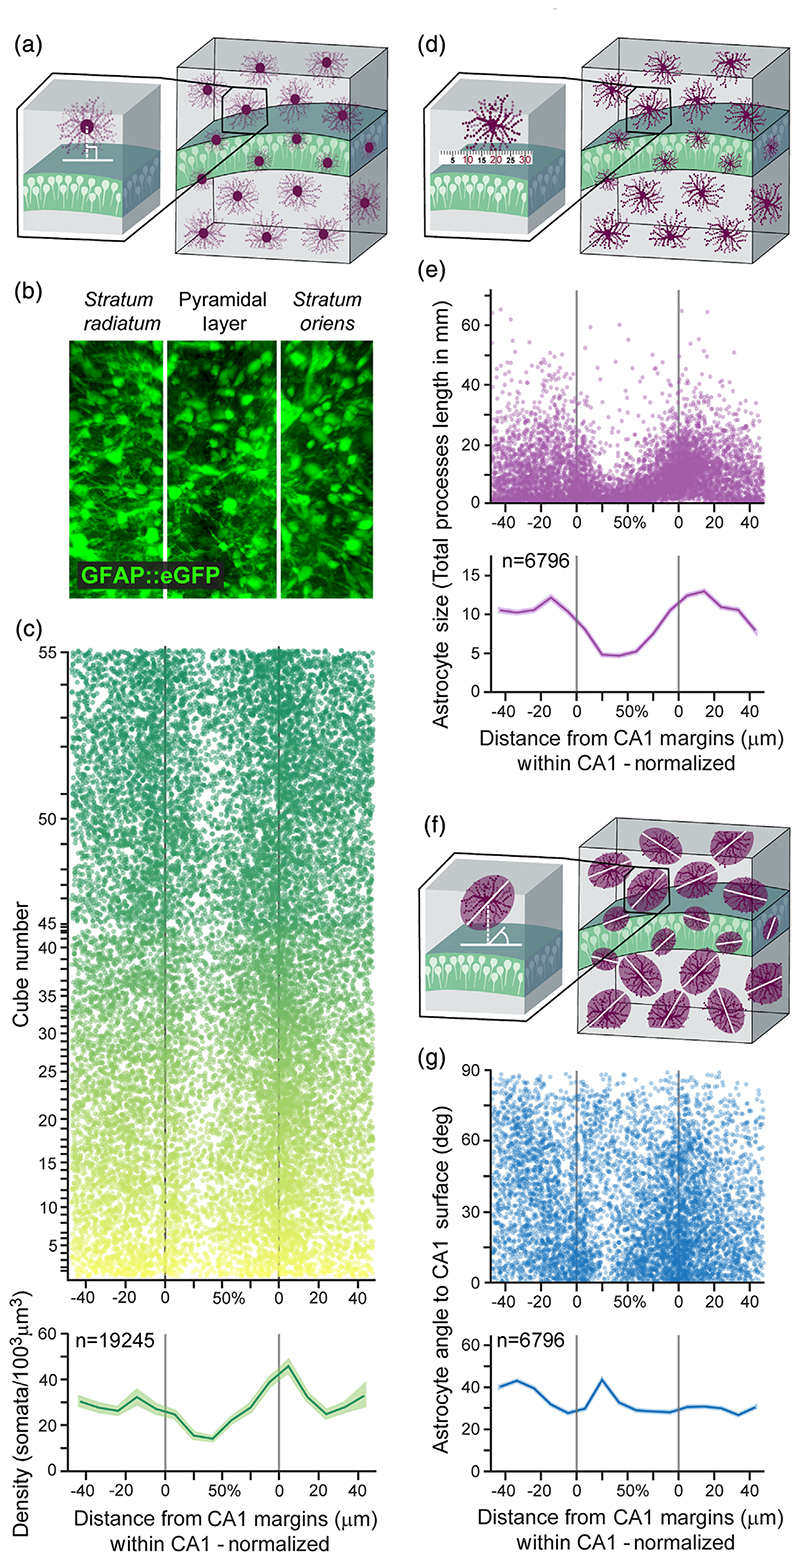
Figure 2. Large scale automatic detection of astrocytic domains and their detailed laminar characterization in CA1.
(a) The distance of each astrocytic soma from the surface of the CA1 pyramidal layer was measured. (b) Representative z-projected cube showing astrocytes (green) in CA1. Lamina borders marked in white. Cube volume: 350 × 300 × 250 μm (c) Astrocyte somata distribution (top; n = 19,245 cells, each represented by a dot, from n = 55 cubes, each displayed in a different semi-transparent color) and average astrocytic density along CA1 lamina (bottom). Density in both stratum radiatum and stratum oriens increases toward the pyramidal layer, and inside this layer density drops toward the middle from both sides. Average density (bottom) presented in bold green, with SEM shading. The distance within the CA1 pyramidal layer is normalized to correct for varying CA1 widths across samples. (d) Astrocyte total processes length was calculated by measuring and summing all the processes. (e) The average total processes length of hippocampal astrocytes (n = 6796 cells, each represented by a semi-transparent dot, from n = 40 cubes) starts to drop at a ~20 μm distance from the pyramidal layer in both stratum radiatum and stratum oriens, and continues to decrease toward the middle. Average total processes length (bottom) presented in bold purple, with SEM shading. (f) Astrocytic orientation was calculated relative to the surface of the CA1 pyramidal layer midline. (g) The orientation of the same astrocytes from panel d (each represented by a semi-transparent dot), relative to the surface of CA1 pyramidal layer. Average orientation (bottom) presented in bold blue, with SEM shading

