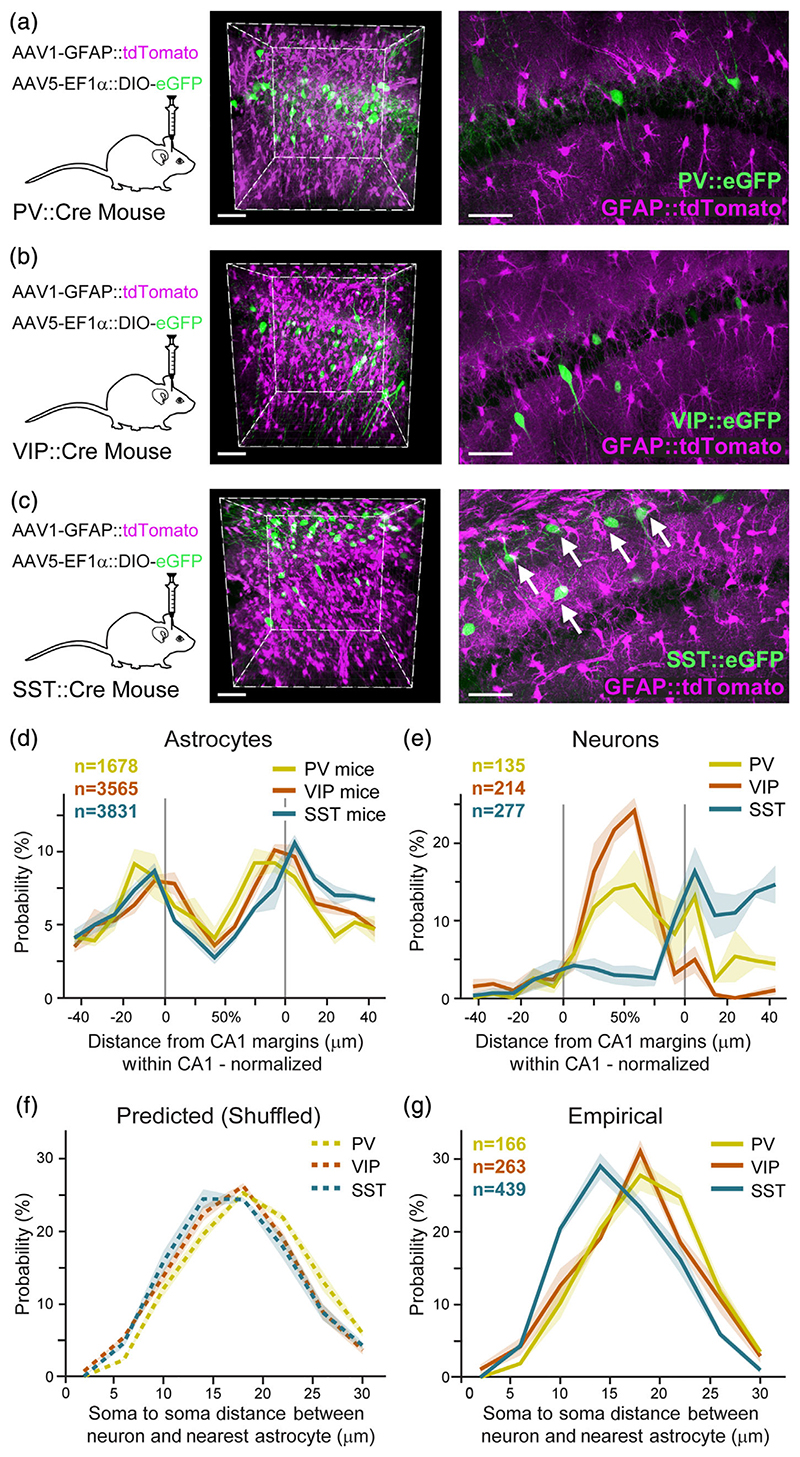
Figure 4. Unique proximity between astrocytes and somatostatin inhibitory neurons.
AAV1-GFAP::tdTomato was injected into CA1 to tag astrocytes (purple), and AAV5-EF1α-DIO-eGFP to tag inhibitory neurons (green) in PV-Cre (n = 3) (a), VIP-Cre (n = 4) (b), or SST-Cre (n = 4) (c) transgenic mice. Co-expression is shown in representative whole 400 × 400 × 450 μm imaging cubes (middle), and one 25 μm-thick optical plane from each cube (right). SST somata were observed in close proximity to astrocytes (white arrows in c right). (d) Astrocyte somata probability distributions in PV (yellow), VIP (orange), and SST (turquoise) mice, as a function of distance from the CA1 pyramidal layer surfaces, showing that astrocytes are highly concentrated on the borders of the pyramidal layer, and show low variance across the different samples. CA1 pyramidal layer borders are marked as in gray. (e) Spatial distribution of PV, VIP, and SST somata, showing their mean density as a function of distance from the CA1 pyramidal layer margins. PV and VIP neurons are concentrated within the pyramidal layer, whereas SST neurons are mostly present in the dendritic layer in stratum oriens, with minor expression in the pyramidal layer. (f) The predicted (permutations-based) distribution of the distances between PV, VIP, and SST somata to their nearest astrocyte soma (g). The empirical probability of SST somata to be in close proximity to the nearest astrocyte soma is significantly larger than that of PV and VIP (p <.01; see Movie S4). Average density for each inhibitory cell type in bold color, with ±SEM shading. Scale bars: 70 μm for cubes, 50 μm for single planes

