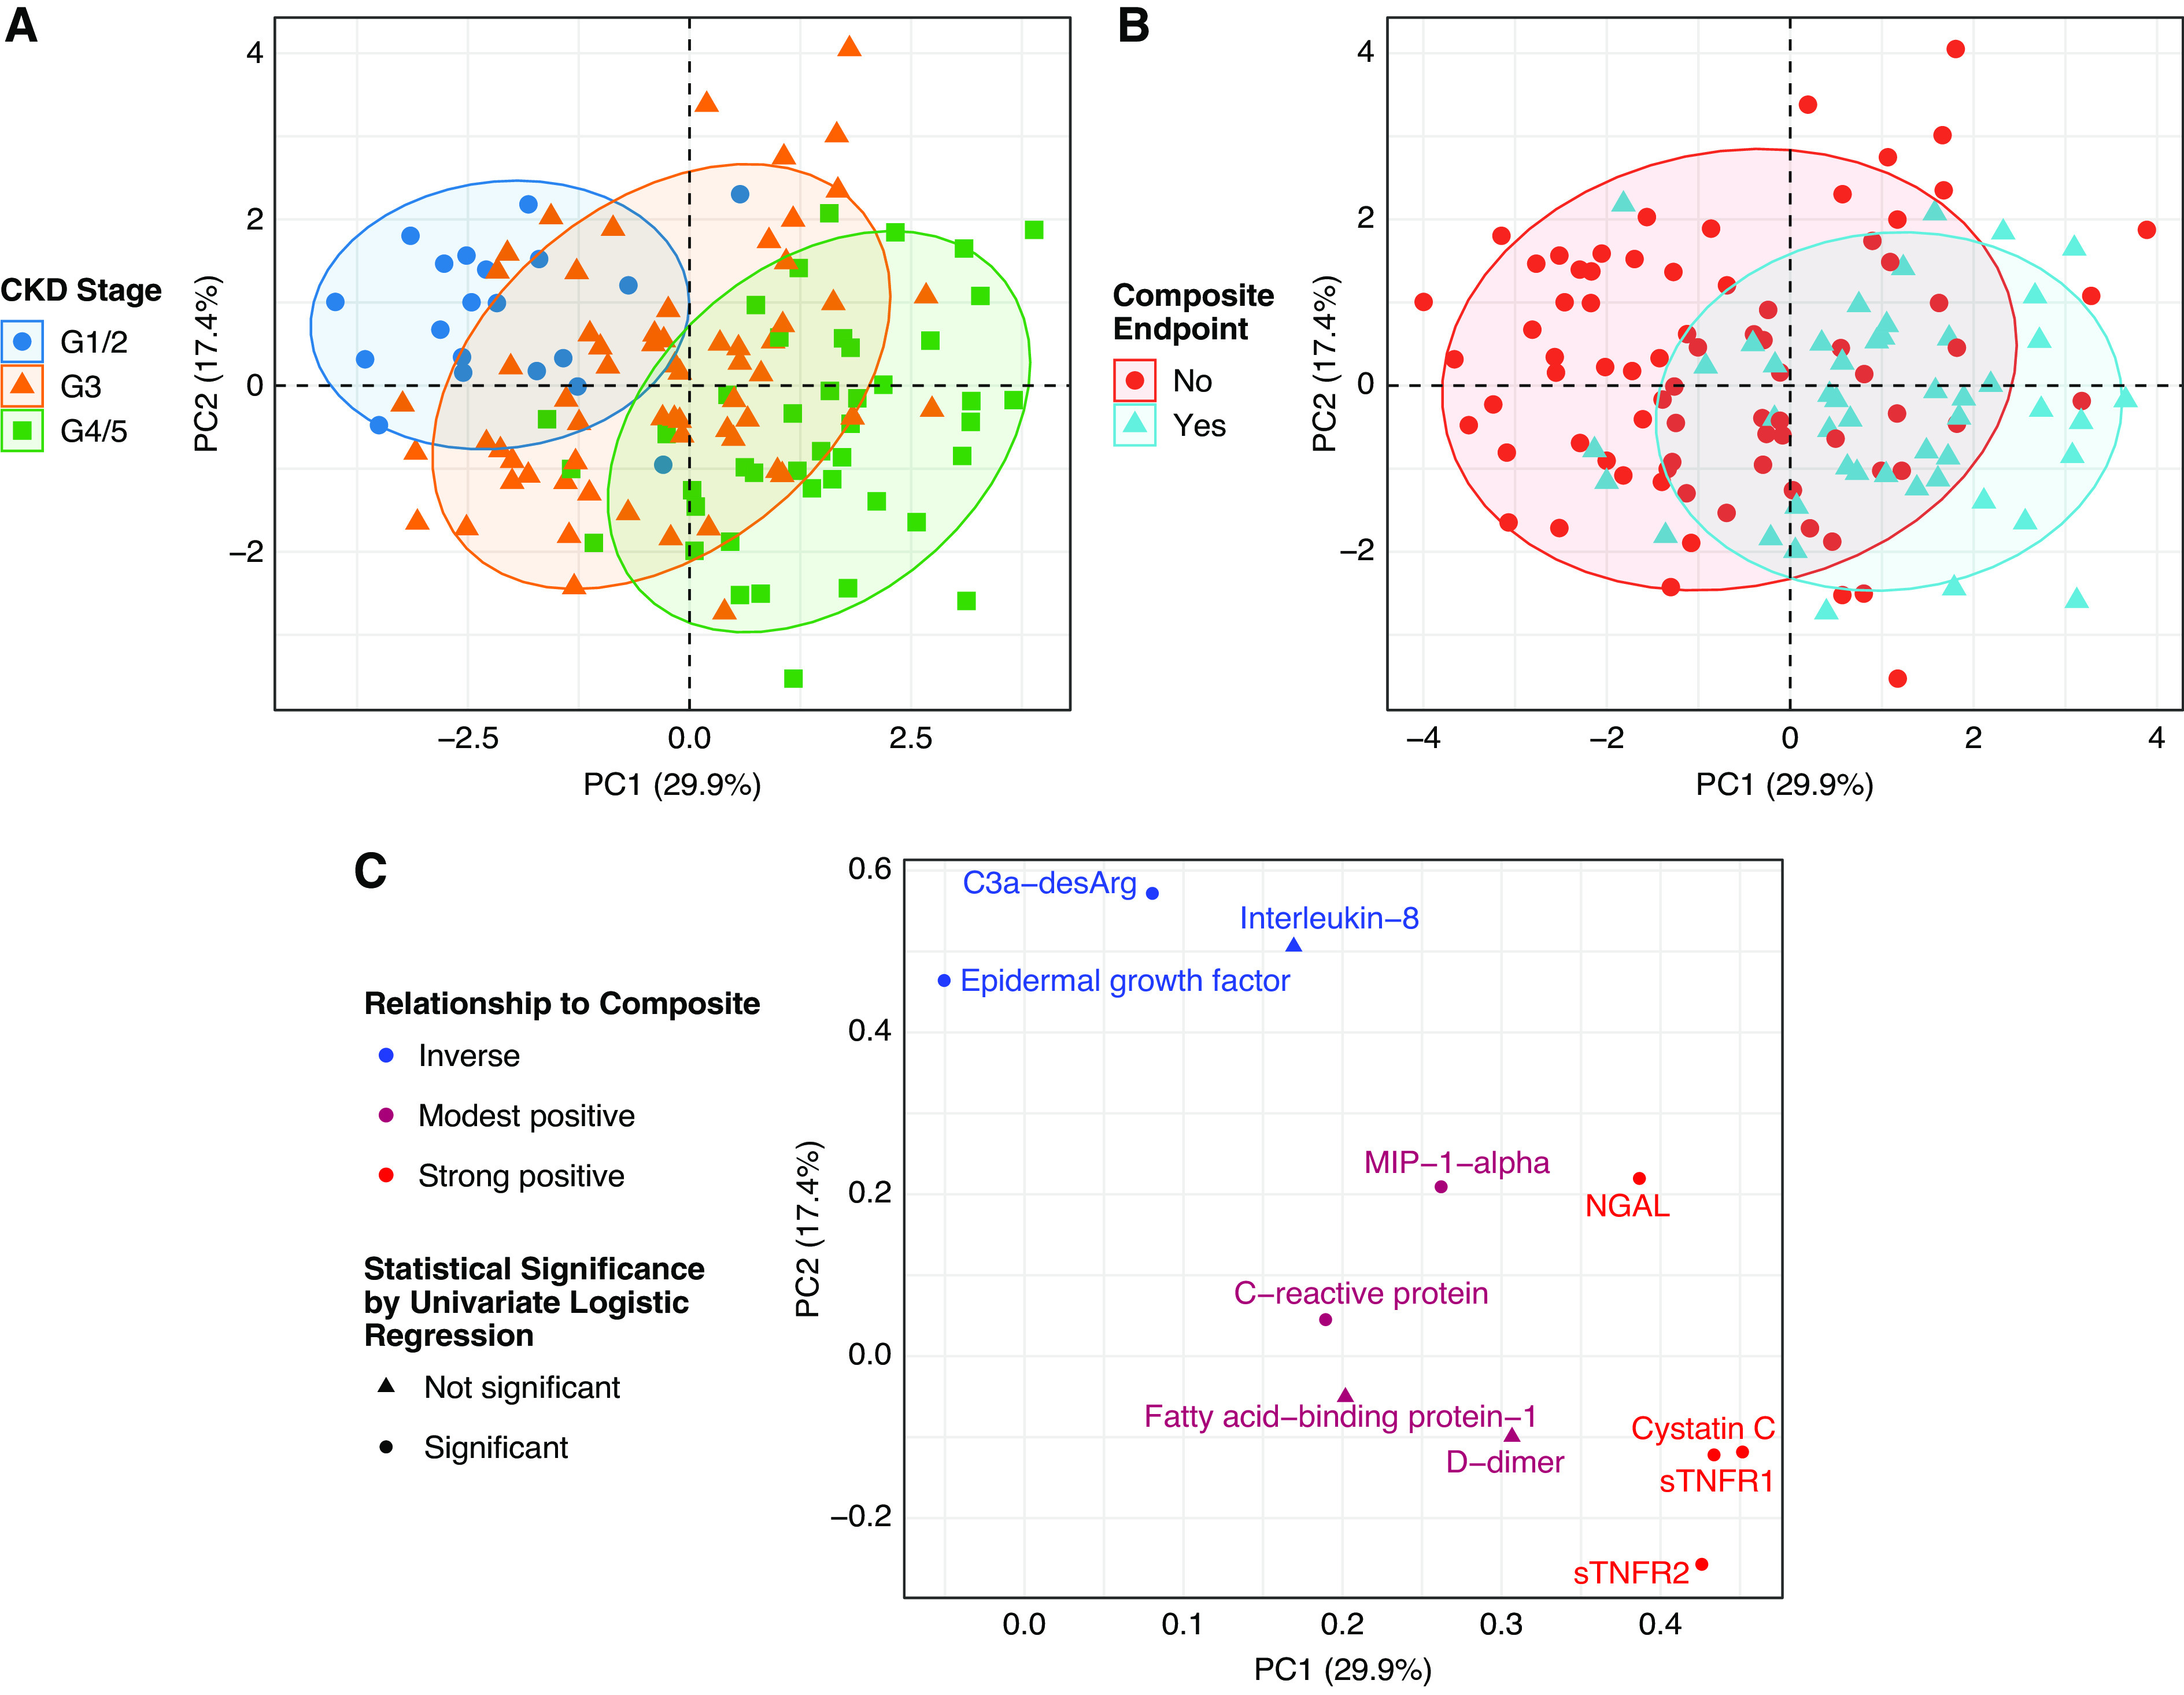
Figure 2.

Principal components analysis illustrates relationships between biomarker expression, CKD stage, and a composite renal and mortality end point. (A) Unsupervised clustering of patients by principal components analysis identifies global shifts in biomarkers across categorical CKD stages, grouped as grades 1 (G1) and 2 (eGFR of ≥60 ml/min per body surface area [BSA]), grade 3 (eGFR of 30–59 ml/min per BSA), and grades 4 and 5 (eGFR of <30 ml/min per BSA). (B) Unsupervised clustering of patients by principal components analysis identifies global shifts in biomarker expression profiles between those who did and did not develop a composite renal and mortality end point during follow-up. (C) A loadings plot from principal components analysis reveals the influential biomarkers that drive the shifts in biomarker expression across CKD stages and when stratified by the composite renal and mortality end point. Individuals with advanced CKD who developed the composite renal and mortality end point had higher expression of biomarkers in the right of the plot, including sTNFR1, sTNFR2, NGAL, and cystatin C. Individuals with earlier stages of CKD who did not develop the composite renal and mortality end point had higher expression of protective factors in the upper left corner of the plot, including C3a-desArg and EGF. The color of the points illustrates the directionality of the relationships between biomarkers and the composite renal and mortality end point (blue, inverse; red, strong positive; modest positive relationships are colored in between both). The shape of the points represents statistical significance of the relationship between biomarkers and the composite renal and mortality end point by univariate logistic regression (circle, statistically significant; triangle, not statistically significant). In (A), (B), and (C), the x and y axes represent principal components 1 and 2, respectively. Composite renal and mortality end point: ≥40% decrease in Chronic Kidney Disease Epidemiology Collaboration eGFR, doubling of serum creatinine, RRT, or mortality. PC, principal component.
