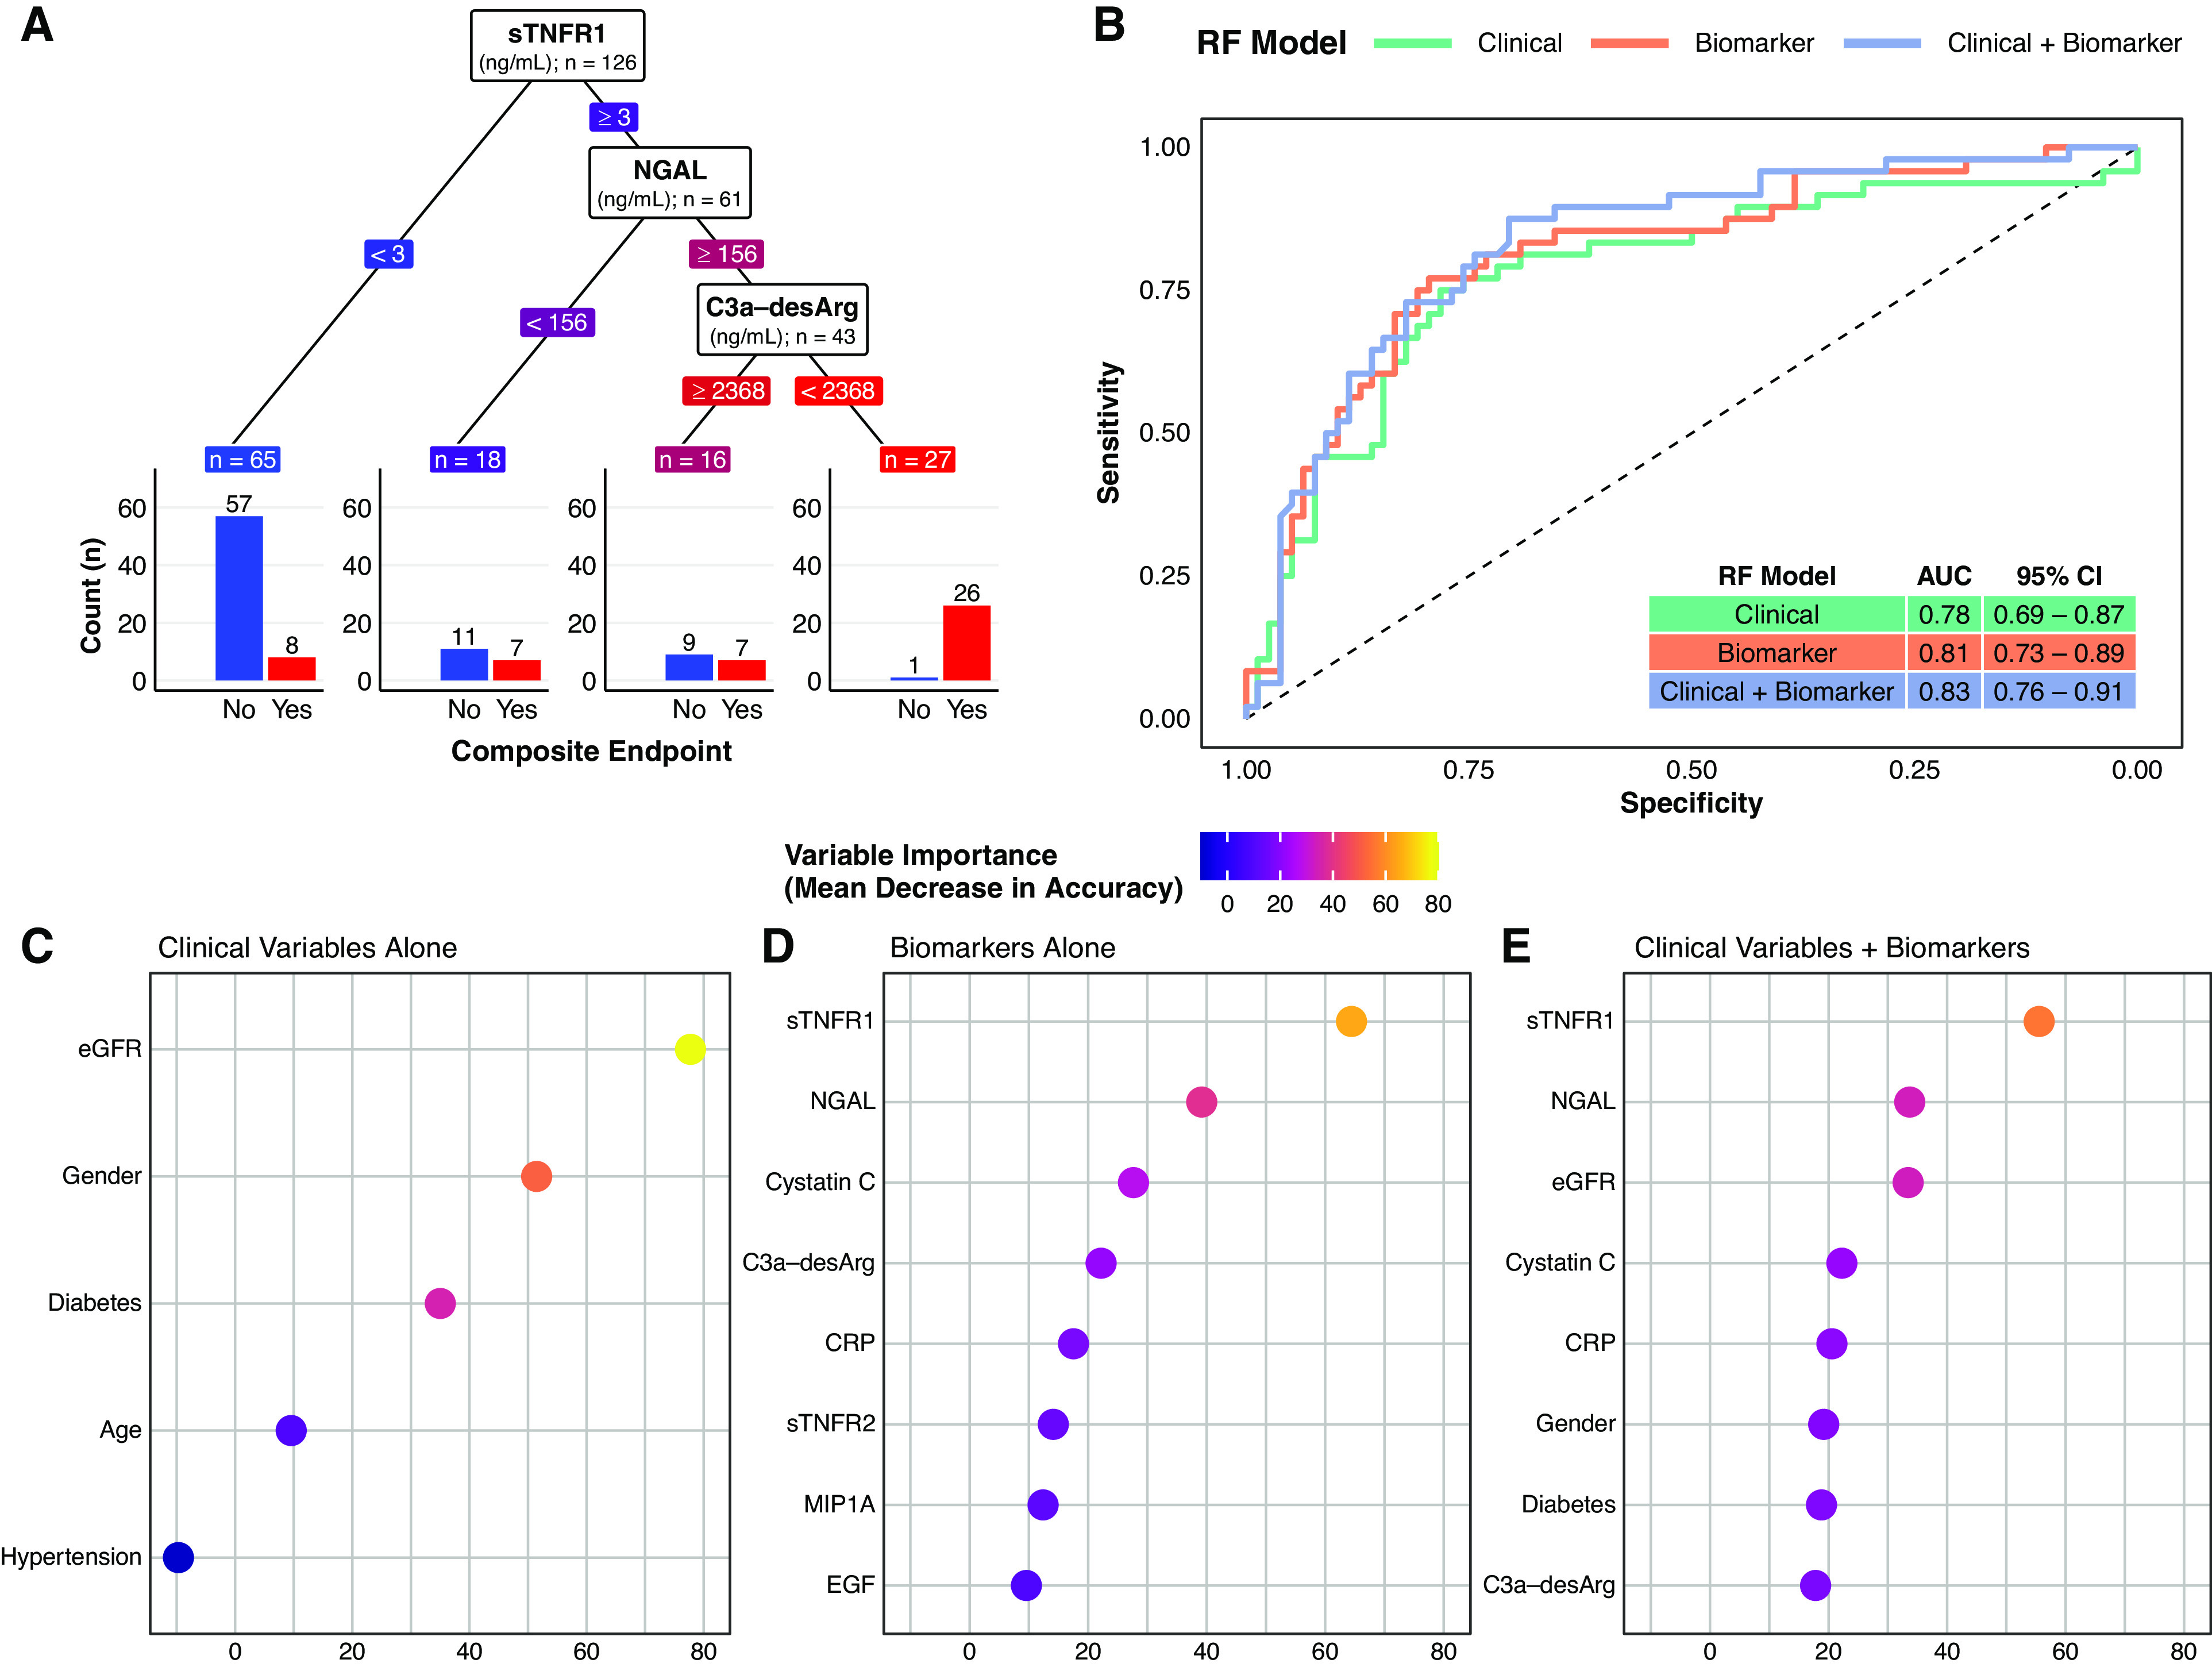
Figure 3.

A supervised machine-learning approach (random forest classifier) illustrates the added predictive value of multiple serum biomarkers for a composite renal and mortality end point, both when considered alone and in addition to conventional clinical variables. (A) Decision tree classification of the composite renal and mortality end point by serum biomarkers in the study cohort. The decision tree highlights the predictive value of simultaneously assessing multiple serum biomarkers. In this decision tree, the three biomarkers are ranked by their proximate level of importance to correct classification of the composite renal and mortality end point, from sTNFR1 (highest) to C3a-desArg (lowest). Individuals with low sTNFR1 values (<3 ng/ml) had a relatively low risk of the composite renal and mortality end point (12%). However, not all individuals with high sTNFR1 values had the same risk of the composite renal and mortality end point. Those with high sTNFR1 (≥3 ng/ml) coupled with low NGAL values (<156 ng/ml) had a 39% risk of the composite renal and mortality end point, whereas those with high sTNFR1 (≥3 ng/ml), high NGAL (≥156 ng/ml), but also high C3a-desArg values (≥2368 ng/ml) had a 44% risk of the composite renal and mortality end point. Conversely, individuals with the triad of high sTNFR1 (≥3 ng/ml), high NGAL (≥156 ng/ml), and low C3a-desArg (<2368 ng/ml), which accounted for approximately 20% of the study cohort, almost universally (96%) developed the composite renal and mortality end point during follow-up. Biomarker values in the decision tree are colored in a continuous gradient from left to right from blue (lower risk) to red (higher risk). (B) Receiver operating characteristic curves for three types of random forest (RF) classification models of the composite renal and mortality end point: clinical variables alone (age, sex, hypertension, diabetes, and baseline eGFR; green), serum biomarkers alone (orange), and clinical variables plus serum biomarkers (purple). A leave-one-out cross-validation approach was implemented for the random forest models. The plot illustrates incremental improvements in correct prediction of the composite renal and mortality end point across the three model types. Area under the curve (AUC) values and associated 95% CIs for the three model types are presented in the inset table: 0.78 for clinical variables alone, 0.81 for serum biomarkers alone, and 0.83 for clinical variables plus serum biomarkers. (C–E) Dot plots of variable importance across the three random forest classification models of the composite renal and mortality end point: (C) clinical variables alone (age, sex, hypertension, diabetes, and baseline eGFR), (D) serum biomarkers alone, and (E) clinical variables plus biomarkers. eGFR was the most important clinical variable, whereas sTNFR1 and NGAL were the biomarkers that provided the most predictive value to the models. All five clinical variables are presented (C), whereas the top eight most important variables are presented for the biomarkers alone and clinical variables plus biomarker models (D and E). The dots are colored in a continuous gradient from navy (lower variable importance) to yellow (higher variable importance). Composite renal and mortality end point: ≥40% decrease in Chronic Kidney Disease Epidemiology Collaboration eGFR, doubling of serum creatinine, RRT, or mortality. CRP, C-reactive protein.
