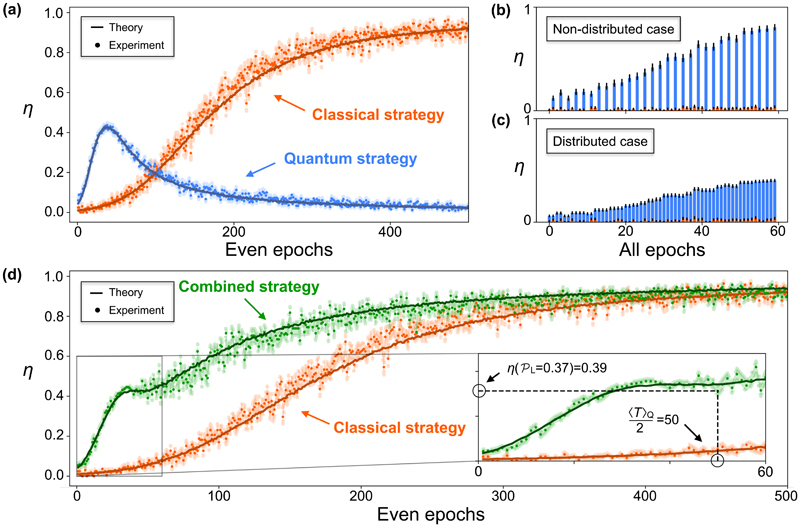
Fig. 4.
Behaviour of the average reward η for different learning strategies. The solid line represents the theoretical data simulated with n = 10,000 agents, while the dots represent the experimental data measured with n = 165 agents. The shaded regions indicate the errors associated to each single data point. (a) η of agents playing a quantum (blue) or classical (orange) strategy. (b) η accounting for rewards obtained only every second epoch in the quantum strategy, compared to (c) the case where the reward is distributed over the two epochs needed to acquire it. (d) Comparison between the classical (orange) and combined (green) strategy, where an advantage over the classical strategy is visible. Here, the agents stop the quantum strategy at their best performance (at ε = 0.396) and continue playing classically. The inset shows the point where agents playing the quantum strategy reach the winning probability P L = 0.37, after 〈T〉Q = 100 epochs.

