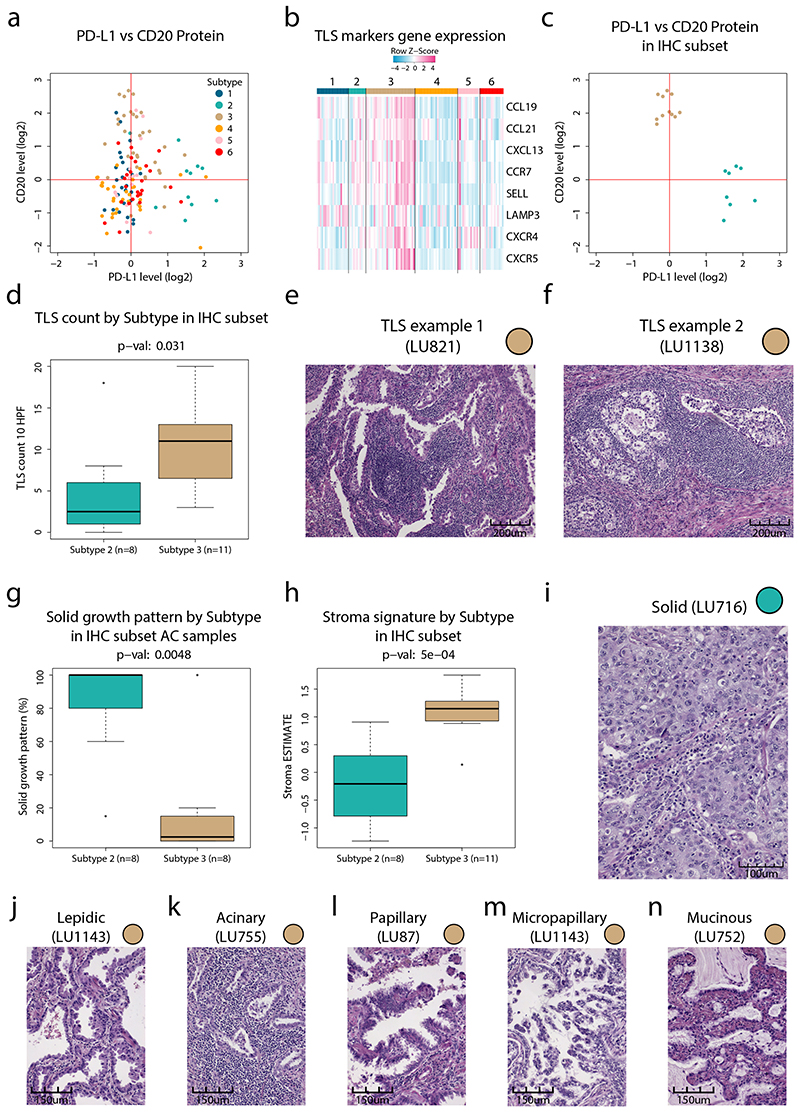
Extended Data Fig. 5. Tertiary lymphoid structures (TLSs) and B-cell infiltration in NSCLC proteome subtypes.
Tertiary lymphoid structures (TLSs) and B-cell infiltration in NSCLC proteome subtypes. a. Scatter plot indicating protein levels of PD-L1 vs the B-cell marker CD20 (MS4A1) in the entire NSCLC cohort (n = 141). b. Heatmap indicating mRNA expression levels of known TLS marker genes. Cohort samples are ordered as in main Figure 1. c. Scatterplot indicating protein levels of PD-L1 vs the B-cell marker CD20 in cohort subset selected for whole section IHC evaluation (n = 19). d. TLS count (10 high power fields per sample) by subtype (n = 19 samples). e-f. IHC images showing examples of tertiary lymphoid structures from two different Subtype 3 samples (out of 11 stained samples). g. Boxplot indicating percent solid growth pattern in AC samples analyzed by whole section IHC (n = 16 samples). h. Boxplot indicating stromal signature in Subtype 2 and 3 samples analyzed by whole section IHC (n = 19 samples). i-n. IHC images showing examples of different growth patterns in six AC samples analyzed by whole section IHC (out of 16 stained samples). For boxplots: middle line, median; box edges, 25th and 75th percentiles; whiskers, most extreme points that do not exceed ±1.5 × the interquartile range (IQR). P-values in boxplots were calculated using two-sided Wilcoxon rank-sum test.

