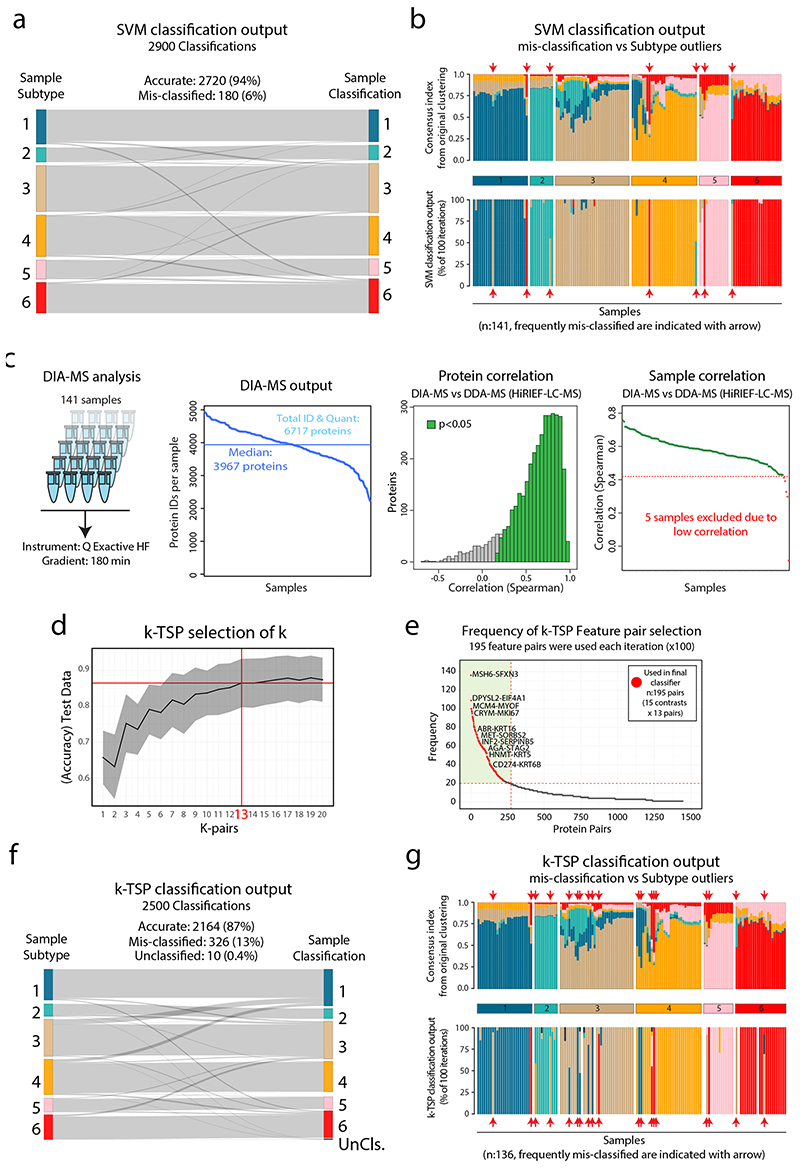
Extended Data Fig. 8. Support-vector machine (SVM) and k-Top Scoring Pairs (k-TSP) based classification of NSCLC subtype.
Support-vector machine (SVM) and k-Top Scoring Pairs (k-TSP) based classification of NSCLC subtype. a. Sankey plot showing the SVM classification output from the SVM testing (100 Monte Carlo cross-validation (MCCV) iterations) with 94% accuracy. b. Stacked bar plots showing the subtype outlierness indicated by consensus index from the original clustering (top) and the classification output form the 100 MCCV iterations (bottom). Indicated by red arrows are seven samples that were frequently mis-classified by the SVM. c. DIA-MS analysis of the 141 samples resulted in the identification of 6,717 proteins (FDR<1%) with a minimum of 2220 proteins per sample and a full overlap of 1202 proteins across all samples. Right part shows protein-wise and sample-wise correlation between DIA-MS based, and DDA-MS based quantifications. d. Selection of (k) for the k-TSP classifier was performed based on accuracy in test data, resulting in k=13 feature pairs. e. k-TSP classifier feature pair importance evaluated by the frequency each feature pair was used across the 100 MCCV iterations. After training, the accuracy of the classifier was estimated using the test set samples. The overall accuracy was reported as the average accuracy of the 100 iterations. The 13 most frequently used feature pairs for each binary model (15 models), resulting in 195 final feature pairs, were used to build the final model. f. Sankay plot showing the classification output from the k-TSP test data (100 iterations) resulting in 87% accuracy. g. Stacked bar plots showing the subtype outlierness indicated by consensus index from the original clustering (top) and the classification output form the 100 MCCV iterations (bottom). Indicated by red arrows are 19 samples that were frequently mis-classified by the k-TSP.

