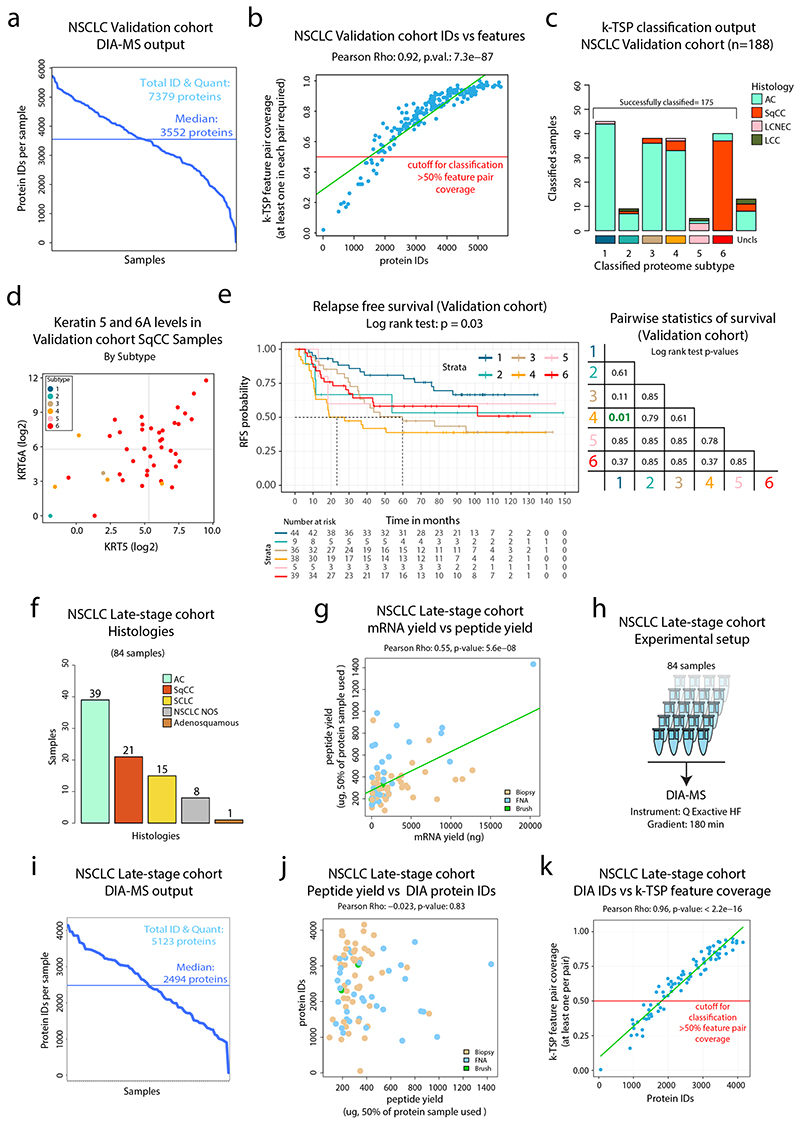
Extended Data Fig. 10. DIA-MS analysis and k-TSP based classification of NSCLC Validation and late-stage cohorts.
DIA-MS analysis and k-TSP based classification of NSCLC Validation and late-stage cohorts. a. DIA-MS analysis of the 208 samples in the NSCLC validation cohort resulted in the identification of 7,379 proteins (FDR<1%), with a median number of identified proteins per sample of 3,552. b. Scatter plot showing k-TSP feature pair coverage vs number of identified proteins per sample. Red line indicate threshold for classification inclusion. c. k-TSP classifier output for the 188 samples where at least 50% of k-TSP feature pairs were covered colored by histological subgroup. d. Scatter plot indicating the levels of SqCC markers Keratin 5 (KRT5) and Keratin 6A (KRT6A) in the SqCC subset of the NSCLC validation cohort color-coded by classified subtype as quantified by DIA-MS. e. (Left) Kaplan-Meier plot showing relapse-free survival in the NSCLC validation cohort by classified subtype (n = 171 samples). P-value was calculated using log-rank test. (Right) Pairwise statistics for relapse free survival in classified subtypes of the NSCLC validation cohort with p-values calculated by log-rank test with Benjamini-Hochberg adjustment. f. Bar plot showing the histologies of the 84 samples included in the late-stage cohort. g. Scatter plot showing mRNA and peptide yields from the sample prep of biopsy samples using Allprep kit followed by digestion, colored by biopsy type (n = 84 samples). h. Experimental setup for DIA-MS analysis of late-stage cohort samples. i. DIA MS analysis of the 84 samples resulted in the identification of 5,124 proteins (FDR<1%), with a median number of identified proteins per sample of 2,494. j. Scatter plot showing peptide yield vs number of identified proteins per sample, colored by biopsy type (n = 84 samples). k. Scatter plot showing k-TSP feature pair coverage vs number of identified proteins per sample (n = 84 samples). Red line indicate threshold for classification inclusion. For scatter plots (b, g, and k), linear regression trendlines are indicated in green. The associated Pearson’s correlation coefficients (Rho) and two-sided p-values from t-distribution with n − 2 degrees of freedom are provided.

