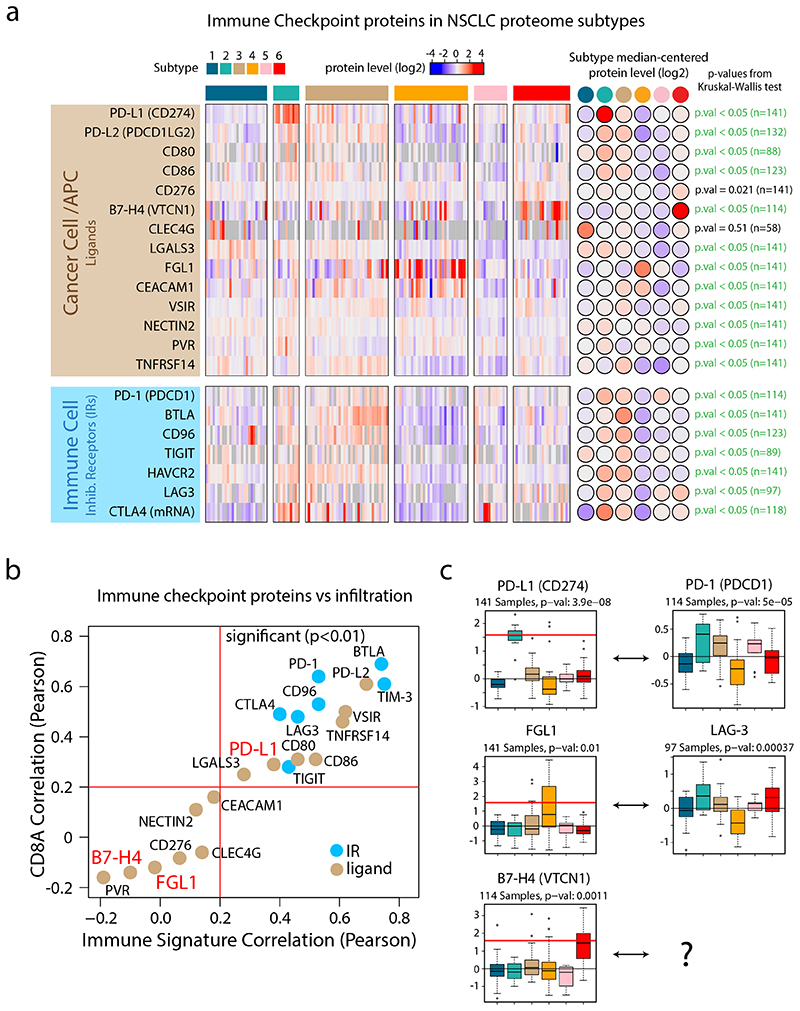
Figure 4. Immune Checkpoints in NSCLC proteome subtypes.
a. Heatmap indicating protein levels of inhibitory receptors (IRs) and their ligands. All values represent protein level quantifications (log2) except for CTLA4 where mRNA levels (log2) are displayed since it was not detected by the MS data. P-values were calculated using Kruskal-Wallis test. b. Scatter plot indicating the correlation between checkpoint proteins and overall immune infiltration signature (x-axis) vs the correlation between checkpoint proteins and CD8A as a marker of cytotoxic T-cells (y-axis). All values were estimated using protein-level quantifications (log2) except for CTLA4 where mRNA levels (log2) were used since it was not detected by the MS analysis. Red lines indicate significant Pearson’s correlation coefficient threshold (p-value < 0.01, two-sided, t-distribution with n − 2 degrees of freedom). c. Boxplots indicating protein levels of inhibitory receptors (IRs) and their ligands (n = 141 samples (PD-L1, FGL1), 114 samples (PD-1, B7-H4) and 97 samples (LAG-3)). The number of samples with quantitative information at protein level is provided. Red lines in boxplots, where present, indicate outlier expression threshold. P-values were calculated using Kruskal-Wallis test. Dunn’s multiple comparison tests with Benjamini-Hochberg adjustment for heatmap (a) and boxplots (c) are available in Supplementary Table 3.

