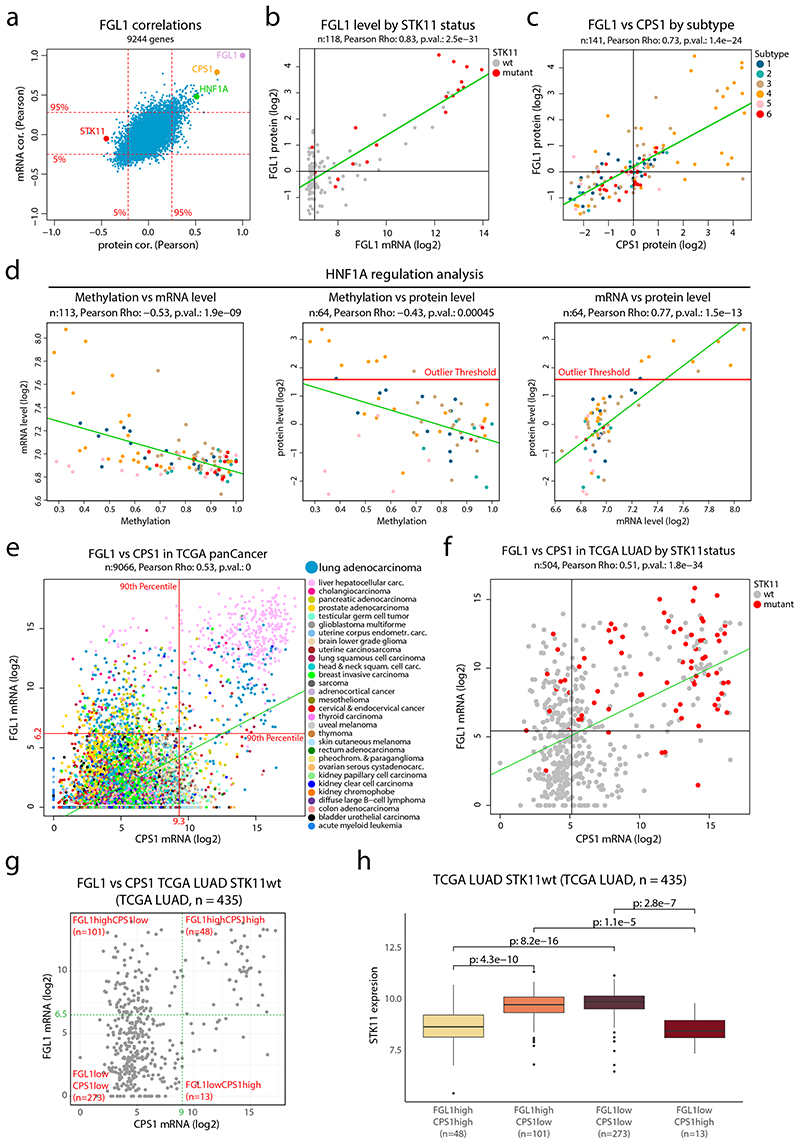
Figure 5. FGL1 and STK11 status in NSCLC cohort and TCGA pan cancer data a.
FGL1 mRNA- and protein-level correlations in the NSCLC cohort for 9,244 genes with overlapping information at mRNA and protein level and quantitative protein level information in at least 70 samples. b. FGL1 mRNA expression plotted against the FGL1 protein level colored by STK11 mutation status (n = 118 samples). c. FGL1 and CPS1 protein levels in the NSCLC cohort colored by proteome subtype (n = 141 samples). d. Scatterplots for evaluation of HNF1A regulation showing promotor methylation vs mRNA level (n = 113 samples) (left), promotor methylation vs protein level (n = 64 samples) (center) and mRNA level vs protein level (n = 64 samples) (right) in NSCLC cohort colored by proteome subtype. e. CPS1 and FGL1 mRNA expression in the TCGA pan cancer dataset colored by cancer type (n = 9,066 samples). Indicated by red lines are the 90th percentiles of mRNA expression for both genes. f. CPS1 and FGL1 mRNA expression in the TCGA lung adenocarcinoma (LUAD) dataset colored by STK11 mutation status (n = 504 samples). Indicated by black lines is the median mRNA expression of both genes. g. Scatterplot showing CPS1 vs FGL1 mRNA levels of STK11wt samples in the TCGA LUAD dataset (n = 435 samples). Indicated in the figure are four expression subgroups, FGL1highCPS1high, FGL1highCPS1low, FGL1lowCPS1low, FGL1lowCPS1high (cut-offs arbitrarily chosen). f. Boxplot indicating the STK11 mRNA expression by expression subgroups as defined in (g) (n = 435 samples). Middle line, median; box edges, 25th and 75th percentiles; whiskers, most extreme points that do not exceed ±1.5 × the interquartile range (IQR). Two-sided Wilcoxon rank-sum tests uncorrected for multiple testing. For scatter plots b-f: linear regression trendline is displayed in green. The associated Pearson’s correlation coefficients (Rho) and two-sided p-values from t-distribution with n − 2 degrees of freedom are provided.

