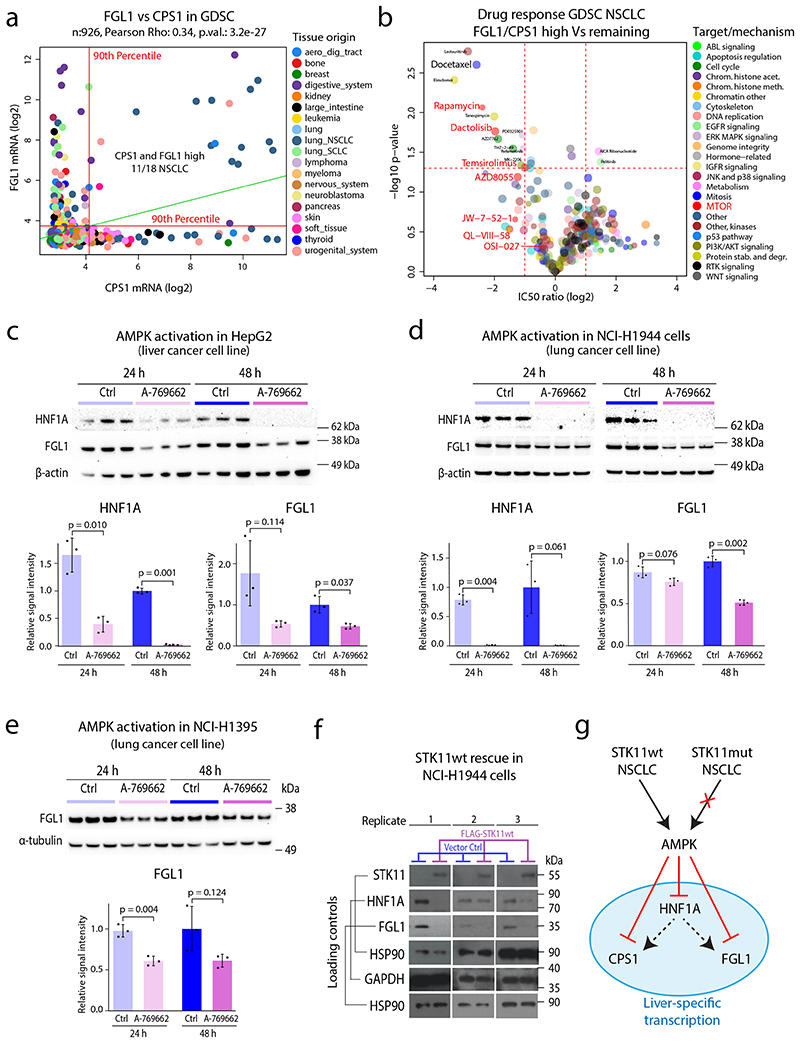
Figure 6. Co-expression of FGL1 and CPS1 predicts sensitivity to docetaxel and mTOR inhibitors and mechanism investigation of STK11-FGL1 signaling.
a. CPS1 and FGL1 mRNA expression in the GDSC dataset colored by cell line tissue origin. Indicated by red lines are the 90th percentiles of mRNA expression for both genes (n = 926 cell lines). Linear regression trendline is displayed in green. The associated Pearson’s correlation coefficient (Rho) and two-sided p-value from t-distribution with n − 2 degrees of freedom are provided. b. Volcano plot indicating differences in drug sensitivity between NSCLC cells with high mRNA expression of CPS1/FGL1 vs remaining NSCLC cells. Indicated in the plot is docetaxel and several drugs targeting mTOR. P-values were calculated by two-sided Welch’s t-test uncorrected for multiple testing. c. HNF1A and FGL1 levels in HepG2 cells after 24 and 48 h treatment with an AMPK activator (250 μM A-769662). The densitometric values were normalized to α-actin and then to the 48-h control mean and are represented as mean ± SD (n = 3 independent cell cultures). The p-values were calculated using Welch’s two-sided t-test. d. HNF1A and FGL1 levels in STK11-mutant NCI-H1944 cells after 24- and 48-h treatment with an AMPK activator (250 μM A-769662). The densitometric values were normalized to β-actin and then to the 48-h control mean and are represented as mean ± SD (n = 3 independent cell cultures). The p-values were calculated using Welch’s two-sided t-test. e. FGL1 levels in STK11-mutant NCI-H1395 cells after 24 and 48 h treatment with an AMPK activator (250 μM A-769662). The densitometric values were normalized to β-tubulin and then to the 48-h control mean and are represented as mean ± SD (n = 3 independent cell cultures). The p values were calculated using Welch’s two-sided t-test. f. STK11, HNF1A, and FGL1 levels in NCI-H1944 cells expressing FLAG-STK11wt or vector control after retroviral transduction. The Western blots show results from three separately transduced cell cultures. g. Model showing the suggested impact of STK11 inactivation in lung cancer cells. STK11 inactivation by e.g., mutation results in loss of AMPK dependent control over liver-specific transcription resulting in upregulation of HNF1A, FGL1, and CPS1. HNF1A is a known master regulator of liver specific transcription and potentially responsible for transactivation of FGL1 and CPS1.

