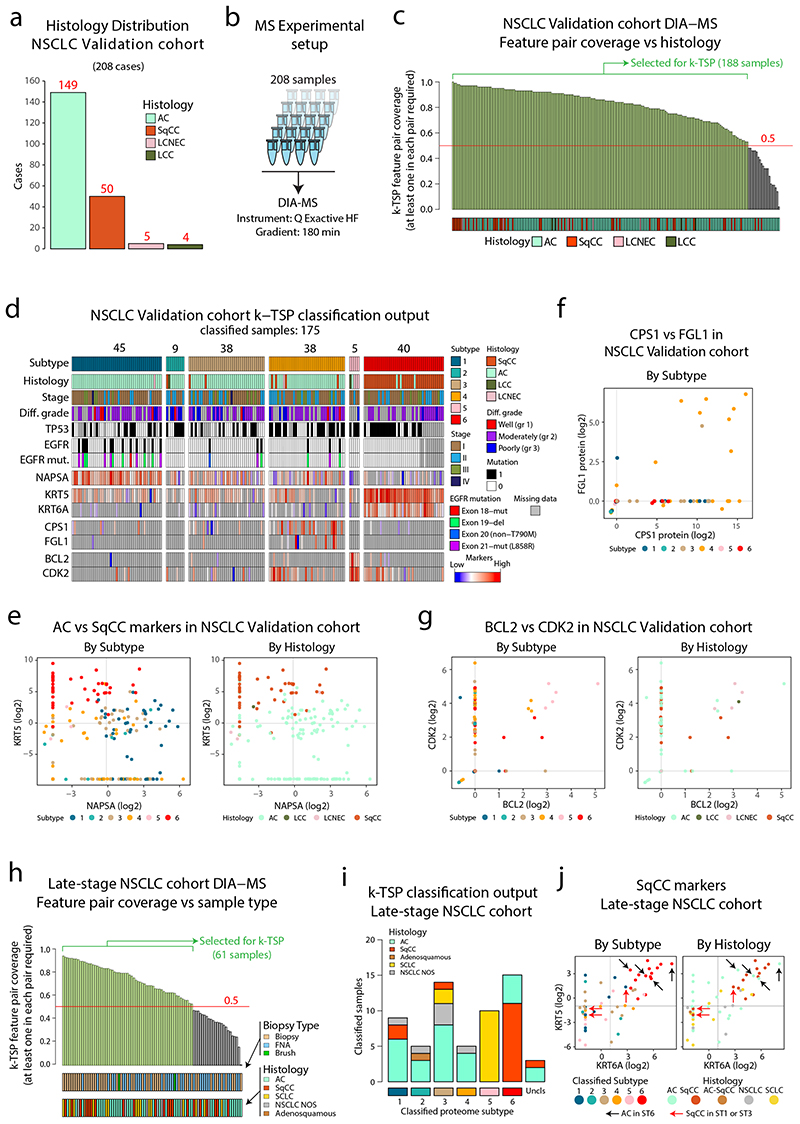
Figure 8. Validation of DIA-MS based NSCLC classification pipelines in two separate NSCLC cohorts.
a. Barplot showing the histology distribution of the 208 cases included in the validation cohort. b. Experimental setup for DIA-MS analysis of validation cohort samples. c. DIA-MS data coverage of the k-TSP feature pairs in the validation cohort in relation to histology. Indicated in the plot are the 188 samples with more than 50% coverage of the k-TSP feature pairs that were included for classification. d. Output from k-TSP-based classification of the NSCLC validation cohort for the 175 samples that were successfully classified. Indicated below is sample annotation by histology, stage, differentiation grade, mutation patterns, and marker levels. e. Scatter plot indicating Napsin A (AC marker) vs Keratin 5 (SqCC marker) protein levels in the classified subset of the validation cohort as quantified by DIA-MS. Left plot is color-coded by classified subtype and right plot by histology. f. FGL1 and CPS1 protein levels in the validation cohort colored by classified proteome subtype. g. Scatter plot indicating BCL2 and CDK2 protein levels in the classified subset of the validation cohort as quantified by DIA-MS. Left plot is color-coded by classified subtype and right plot by histology. h. DIA-MS data coverage of the k-TSP feature pairs in the late-stage NSCLC cohort in relation to biopsy type and histology. Biopsy = forceps biopsy by bronchoscopy, FNA = fine needle aspiration by EBUS (endobronchial ultrasound), Brush = bronchial brush by bronchoscopy. i. k-TSP classifier output for the 61 late-stage cohort samples where at least 50% of k-TSP feature pairs were covered colored by histological subgroup. j. Scatter plots indicating the protein levels of SqCC markers Keratin 5 (KRT5) and Keratin 6A (KRT6A) in the classified subset of the late-stage NSCLC cohort as quantified by DIA-MS. Left plot is color-coded by classified subtype and right plot by histology. Indicated by arrows in the plots are cases with unexpected classification output. Lines indicate median abundances.

