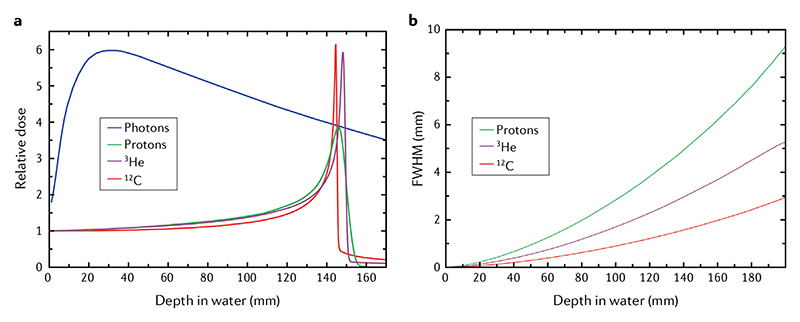
Figure 1. Heavy ion physics.
a| Depth-dose distributions showing the Bragg peak for different ions and the reduced straggling of heavier ions. The X-ray depth–dose curve is calculated for a high-energy 21-MeV linac. Energies of the ions correspond approximately to the same range (15 cm in tissue): 148 MeV1H beam, 170 MeV/n3He beam and 270 MeV/n12C beam. b | Lateral broadening (full width at half maximum (FWHM) of the Gaussian distribution, see Eq. 3) for the same ions. The widening of the beam should be compared with typical entrance spot sizes of proton and ion beams of ~5–10 mm. Image from the GSI image gallery, distributed under Creative Commons CC-BY. Figure is adapted from REF.201, CC BY 4.0.

