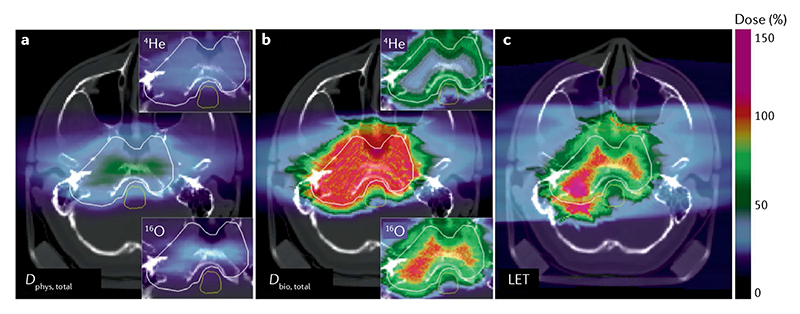
Figure 7. Biologically optimized multi-ion plan for a hypoxic skull base chordoma (hypoxia is assumed to be concentred in the central part of the tumour).
a | Total physical dose (D phys, total). Insets correspond to the partial contributions from 16O and 4He fields. Colour scale represents the relative dose compared with the dose of 2 Gy. b | Total biological (relative biological effectiveness–oxygen enhancement ratio (RBE-OER)-weighted) dose (D bio, total). Colour scale represents the relative linear energy transfer (LET) compared with a fixed value of 60 keV μm-1. c | Dose-averaged LET distribution. Colour scale as in part b. Calculation with TRiP98 code from Sokol et al.29, reproduced with permission from IOP. Figure is adapted from REF.29, CC BY 4.0.

