. 2021 Oct 8;81(23):6004–6017. doi: 10.1158/0008-5472.CAN-21-1499

Figure 4.

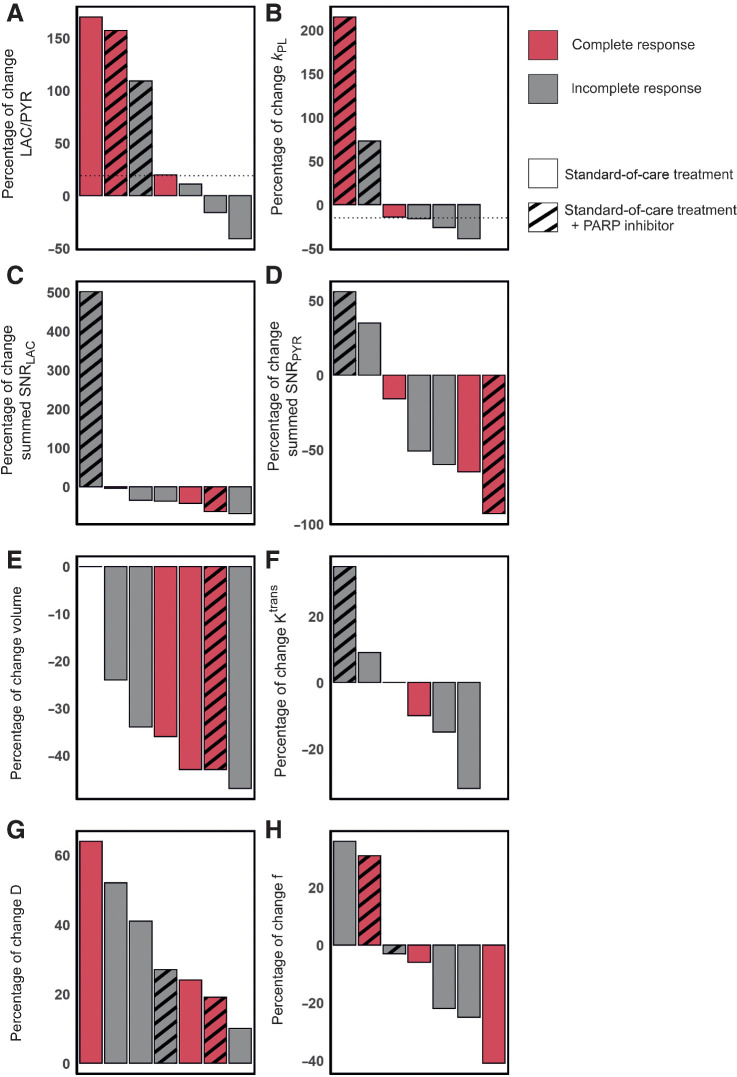
Figure 4. Changes in hyperpolarized 13C-MRI and 1H-MRI parameters in seven patients with complete and incomplete responses. Results are shown for standard-of-care treatment with and without PARP inhibitor treatment. A, A threshold of +20% change in LAC/PYR distinguished responders from nonresponders on standard-of-care therapy (shown with a dashed horizontal line). One nonresponder receiving PARP inhibitor treatment also showed an increase in LAC/PYR of ≥20%, which may be explained by NAD+ availability (see main text). B, A threshold set at a −15% change in kPL (dashed horizontal line) distinguished responders from nonresponders on standard-of-care therapy. A patient receiving PARP inhibitor treatment in addition, but demonstrating pCR, also showed a change in kPL above this threshold. kPL was not available for one patient due to a technical failure. C–H, There were no thresholds that could be used to distinguish pCR from non-pCR for any of the remaining 1H-MRI or 13C-MRI parameters. Change in Ktrans was not evaluable for one patient where fat saturation failed at baseline.

Changes in hyperpolarized 13C-MRI and 1H-MRI parameters in seven patients with complete and incomplete responses. Results are shown for standard-of-care treatment with and without PARP inhibitor treatment. A, A threshold of +20% change in LAC/PYR distinguished responders from nonresponders on standard-of-care therapy (shown with a dashed horizontal line). One nonresponder receiving PARP inhibitor treatment also showed an increase in LAC/PYR of ≥20%, which may be explained by NAD+ availability (see main text). B, A threshold set at a −15% change in kPL (dashed horizontal line) distinguished responders from nonresponders on standard-of-care therapy. A patient receiving PARP inhibitor treatment in addition, but demonstrating pCR, also showed a change in kPL above this threshold. kPL was not available for one patient due to a technical failure. C–H, There were no thresholds that could be used to distinguish pCR from non-pCR for any of the remaining 1H-MRI or 13C-MRI parameters. Change in Ktrans was not evaluable for one patient where fat saturation failed at baseline.