. 2021 Oct 8;81(23):6004–6017. doi: 10.1158/0008-5472.CAN-21-1499

Figure 6.

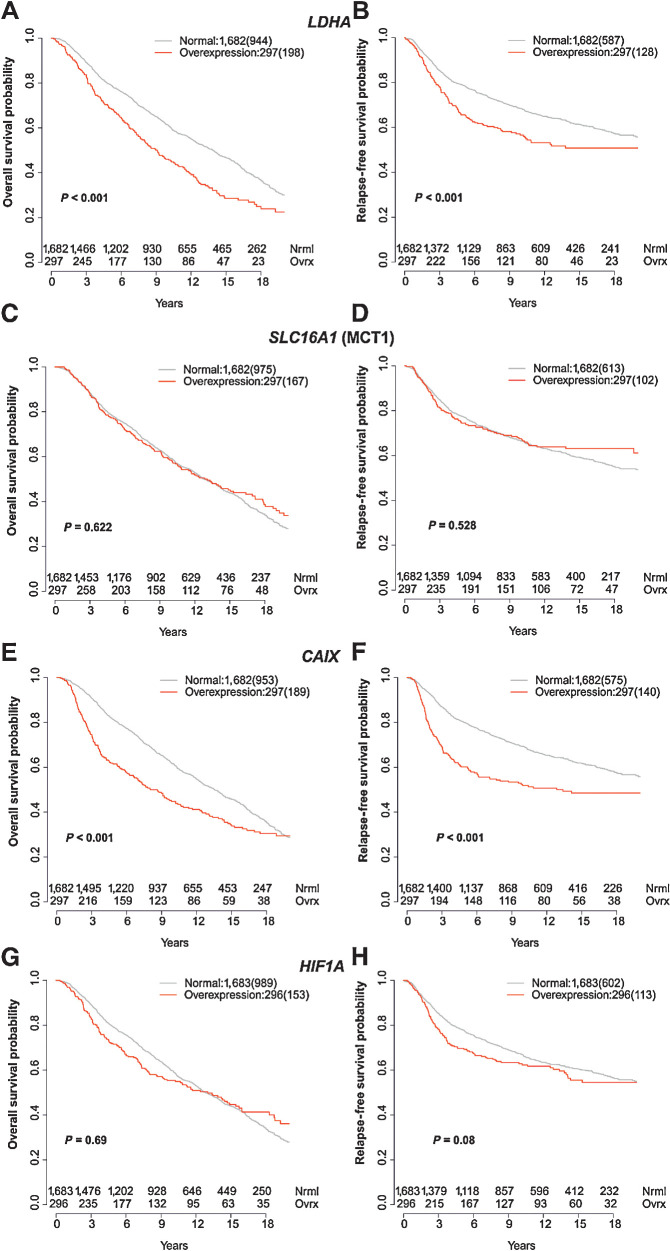
Figure 6. Correlation of LDHA, SLC16A1 (MCT1), CAIX, and HIF1A expression with survival in METABRIC. Kaplan–Meier curves for normal expression and overexpression (85th percentile) of LDHA (A and B), SLC16A1 (MCT) (C and D), HIF1A (E and F), and CAIX (G and H). The left column shows overall survival and the right column relapse-free survival. Number of events are shown in brackets.

Correlation of LDHA, SLC16A1 (MCT1), CAIX, and HIF1A expression with survival in METABRIC. Kaplan–Meier curves for normal expression and overexpression (85th percentile) of LDHA (A and B), SLC16A1 (MCT) (C and D), HIF1A (E and F), and CAIX (G and H). The left column shows overall survival and the right column relapse-free survival. Number of events are shown in brackets.