. 2021 Sep 15;27(23):6479–6490. doi: 10.1158/1078-0432.CCR-20-4366

Figure 2.

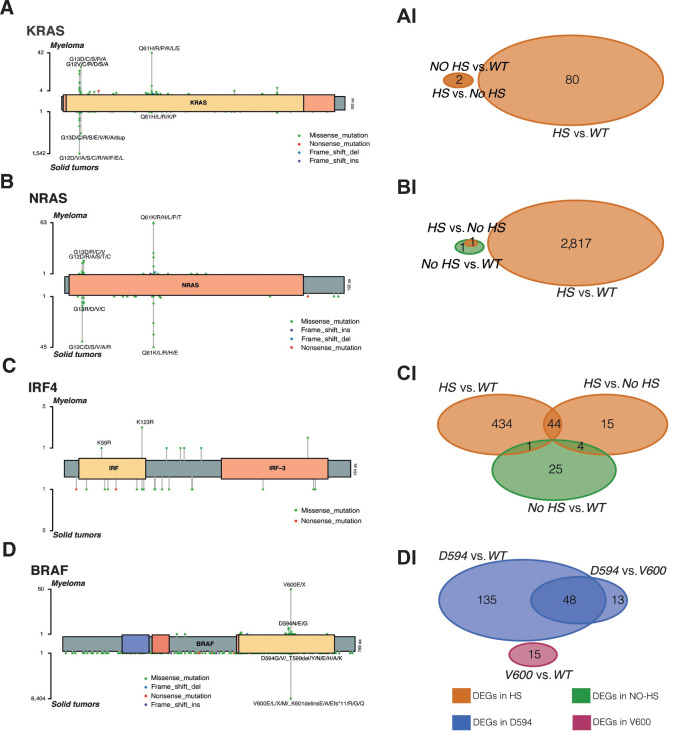
Figure 2. Hotspot versus non-HS and WT analysis. A–D, Lollipop plots for the four main mutated genes; each plot shows in the top the hotspots in multiple myeloma, at the bottom the hotspots in the peculiar solid cancers. Lollipop plots have been generated applying the R package maftools. AI–DI, Venn plots for each differential expression analysis.

Hotspot versus non-HS and WT analysis. AD, Lollipop plots for the four main mutated genes; each plot shows in the top the hotspots in multiple myeloma, at the bottom the hotspots in the peculiar solid cancers. Lollipop plots have been generated applying the R package maftools. AI–DI, Venn plots for each differential expression analysis.