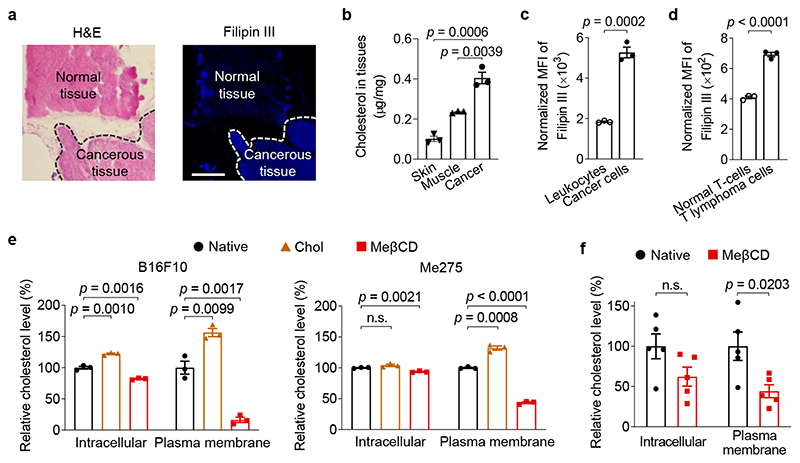
Fig. 1. Cholesterol is enriched in the plasma membrane of cancer cells.
a, B16F10 tumour tissues (indicated with dash lines) and the adjacent normal tissues were stained with hematoxylin and eosin (H&E) and Filipin III (shown in blue colour). Scale bar, 500 μm. b, Cholesterol levels in B16F10 tumour tissues and the adjacent skin and muscle tissues (n = 3). c, d, Membrane cholesterol levels of tumour-infiltrating leukocytes (CD45.2+) and cancer cells (tdTomato+) in 4T1-Fluc-tdTomato tumour (c), and murine T lymphoma cells (EG7-OVA) and normal murine T-cells (d) determined by Filipin III staining (n = 3). The displayed MFI values were normalized by forward scatter area (FSC-A) of corresponding samples. e, f, Relative intracellular and plasma membrane levels of cholesterol (normalized to that of native cells) in murine B16F10 and human Me275 cancer cells treated with water-soluble cholesterol/methyl-β-cyclodextrin complex (Chol) or methyl-β-cyclodextrin (MeβCD) in vitro (e, n = 3) and in vivo (f, B16F10, n = 5). Data are one representative of at least two independent experiments with biological replicates. P values were determined by unpaired Student’s t test. Error bars represent standard error of the mean (SEM). MFI, mean fluorescence intensity; n.s., not significant.

