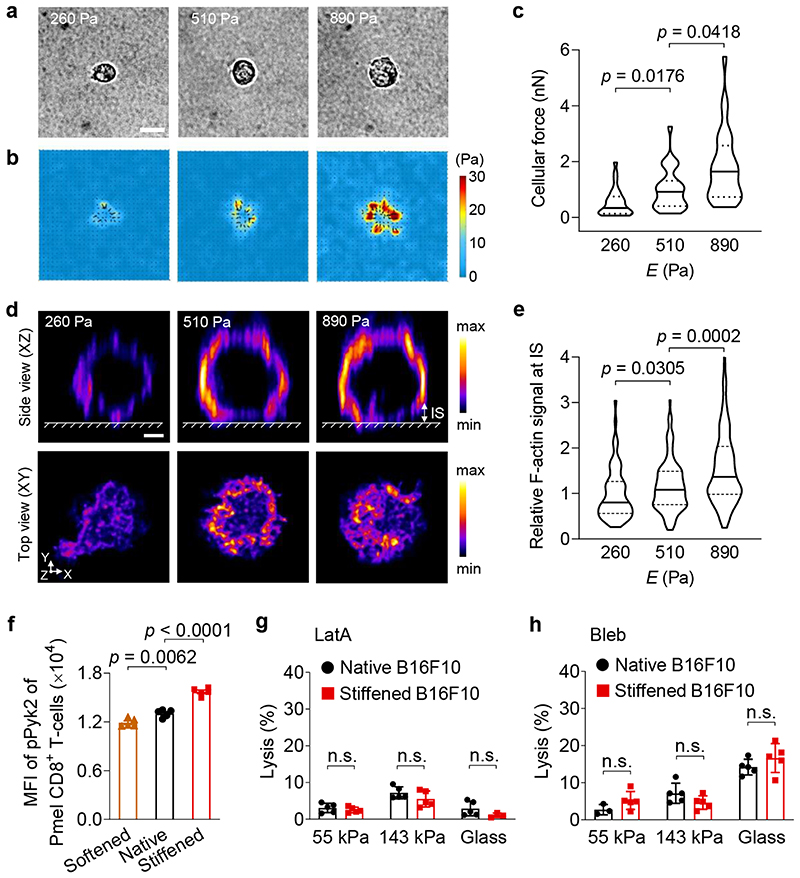
Fig. 6. Enhanced cytotoxicity against stiffened cancer cells is mediated by T-cell forces.
a-c, Forces exerted by activated Pmel CD8+ T-cells on polyacrylamide (PA) hydrogel substrates of indicated stiffness coated with anti-CD3 and anti-CD28 antibodies were measured using traction force microscopy. Shown are representative bright field images (a) and the corresponding traction stress maps (b), and average total force per cell (c) (n = 29 individual cells). The colour bar indicates the magnitude of stress. Scale bar, 5 μm. d, Representative deconvoluted confocal fluorescence images of F-actin of activated Pmel CD8+ T-cells on PA hydrogel substrates of indicated stiffness coated with anti-CD3 and anti-CD28 antibodies. The upper row shows the side view (XZ plane); the lower row shows the top view (XY plane) of F-actin at the T-cell immunological synapse (IS, defined as the structure between the surface of hydrogel and a height of 2 μm above the surface of the hydrogel). The colour bar indicates the intensity of the F-actin fluorescence signal. Scale bar, 2 μm. e, Relative total fluorescence intensity (normalized by the mean value at 260 Pa) of F-actin at the IS in the images from (d) (n = 66, 119, and 179 individual cells for 260, 510 and 890 Pa, respectively). f, MFI of phosphorylated Pyk2 (pPyk2) in activated Pmel CD8+ T-cells co-cultured with native, Chol-treated (softened) or MeβCD-treated (stiffened) B16F10 cancer cells (n = 5). g, h, Lysis percentage of native and stiffened B16F10 cancer cells co-cultured with activated Pmel CD8+ T-cells (E:T ratio = 10:1), which were pre-treated with latrunculin A (LatA, g) or blebbistatin (Bleb, h) (n = 5). P values were determined by Kruskal-Wallis test in (c, e) or unpaired Student’s t test in (f-h). Error bars represent SEM. In the violin plots (c, e), the middle solid line shows median, and lower and upper dash lines show 25th and 75th percentiles, respectively. MFI, mean fluorescence intensity; n.s., not significant. All data are one representative of at least two independent experiments with biological replicates.

