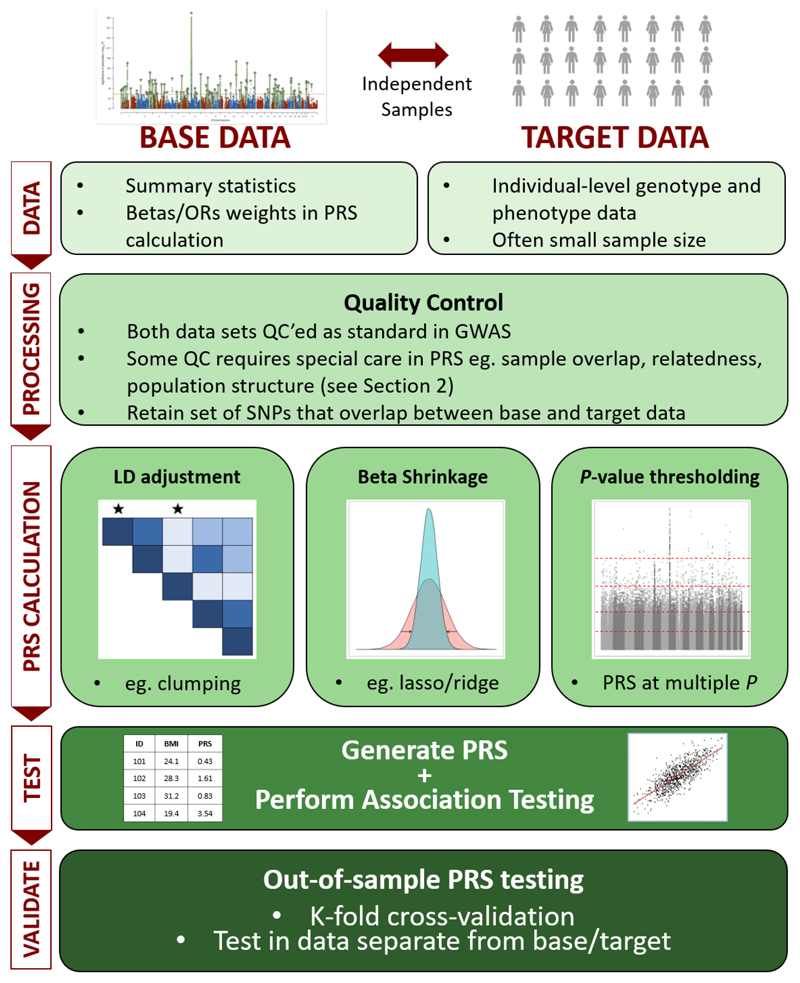
Figure 1.
The Polygenic Risk Score (PRS) analysis process. PRS can be defined by their use of base and target data, as in Section 1. Quality control of both data sets is described in Section 2, while the different approaches to calculating PRS – e.g. LD adjustment via clumping, beta shrinkage using lasso regression, P-value thresholding – is summarised in Section 3. Issues relating to exploiting PRS for association analyses to test hypotheses, including interpretation of results and avoidance of overfitting to the data, are detailed in Section 4.

