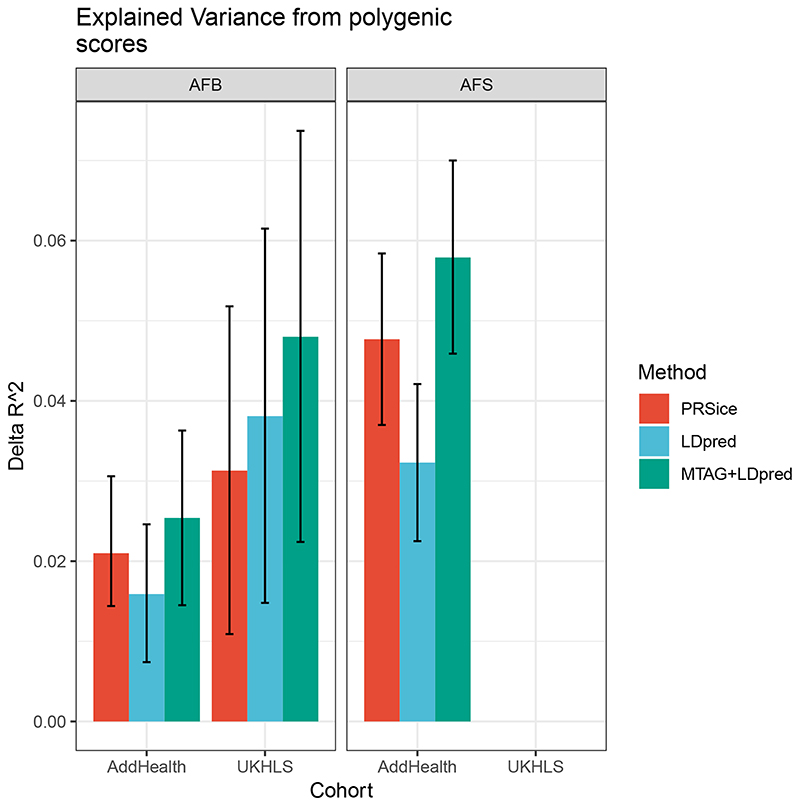
Figure 2. Variance explained from polygenic scores for age at first birth (AFB) and age at first sex (AFS) using different methods in out-of-sample cohorts.
Shows the out-of-sample prediction scores for AFB and AFS performed in two cohorts: The National Longitudinal Study of Adolescence to Adult Health (Add Health) and the UK Household Longitudinal Study (UKLS). The bars represent the delta (Δ) R2, also indicating confidence intervals. R2 measures of the proportion of variance of the phenotype that is explained by the model and Δ R2 shows the change in R2 values when comparing a model without the PGS to one that includes the PGS. The different methods of PRSice, LDPred and MTAG+LDPred are described in the Supplementary Information, Section 5.

