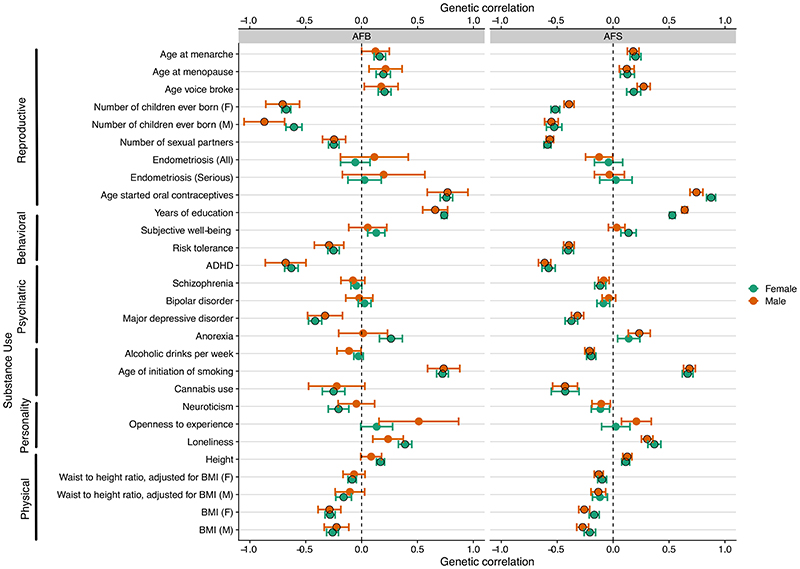
Figure 3. Genetic correlations of age at first birth (A) and age at first sex (B) with a selection of related traits.
The horizontal bars represent 95% confidence intervals. If the trait was initially assessed separately for males and females, this is indicated on the left in brackets with F referring to females and M to males. The black circles represent the Bonferonni significant correlations, but the magnitude of the effect (rg, the genetic correlation) is the most informative. Definitions and sources of all traits can be found in the Supplementary Information, Section 7.1 with full results shown in Supplementary Table S11.

