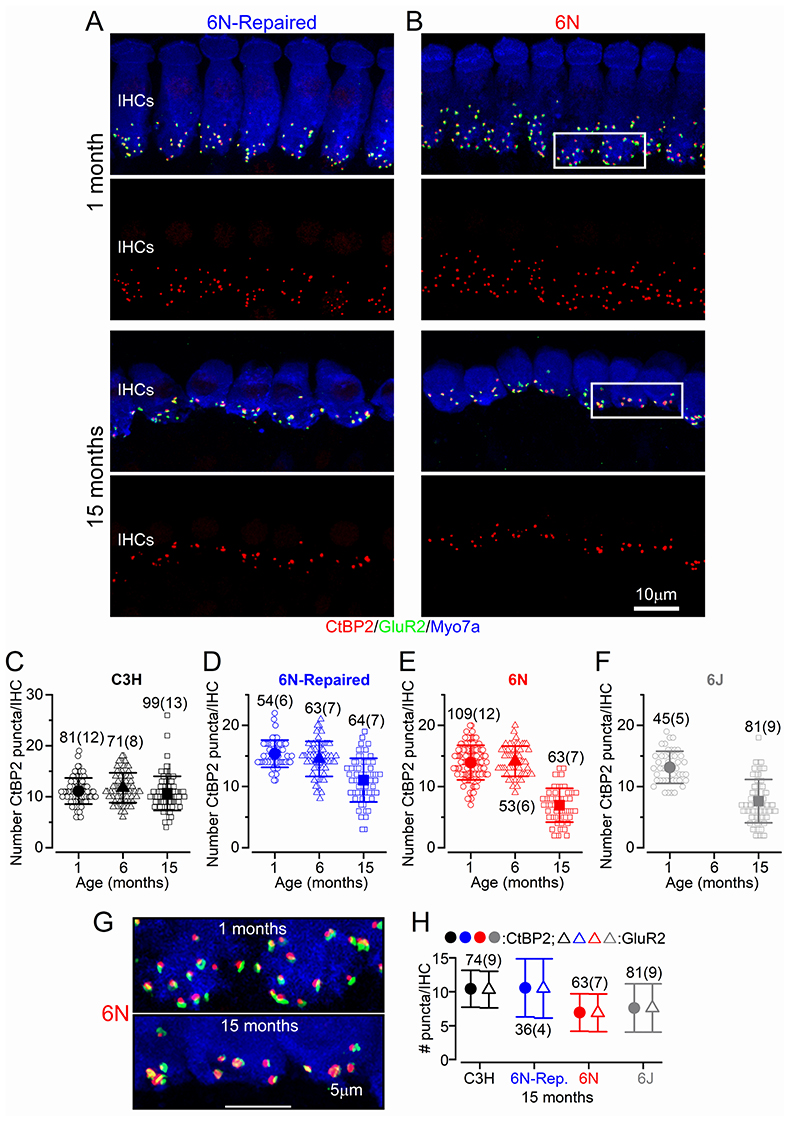
Figure 7. Ribbon synapse number is reduced in IHCs from most mouse strains.
A,B, Maximum intensity projections of confocal z-stacks of IHCs taken from the apical cochlear region (9-12 kHz) of 6N-Repaired (A) and 6N (B) mice at 1 and 15 months using antibodies against CtBP2 (ribbon synaptic marker: red) and GluR2 (postsynaptic marker: green). Myosin 7a (Myo7a) was used as the IHC marker (blue). Scale bar 10 μm. C-F, Number of CtBP2 puncta as a function of age in IHCs from C3H (C), 6N-Repaired (D), 6N (E) and 6J (F) mice. Data are plotted as mean values (larger closed symbols) and individual CtBP2 counts (smaller open symbols). G, Enlarged view of the two regions highlighted (rectangular white boxes) in panel B, showing the juxtaposed CtBP2 (red) and GluR2 (green) puncta. H, Number of CtBP2 and GluR2 puncta in IHCs from 15 month old mice (C3H, 6N-Repaired, 6N and 6J). Numbers above or below the data in panels C-F and H represent the IHCs (and mice) used for each time point. Average values are mean ± S.D.

