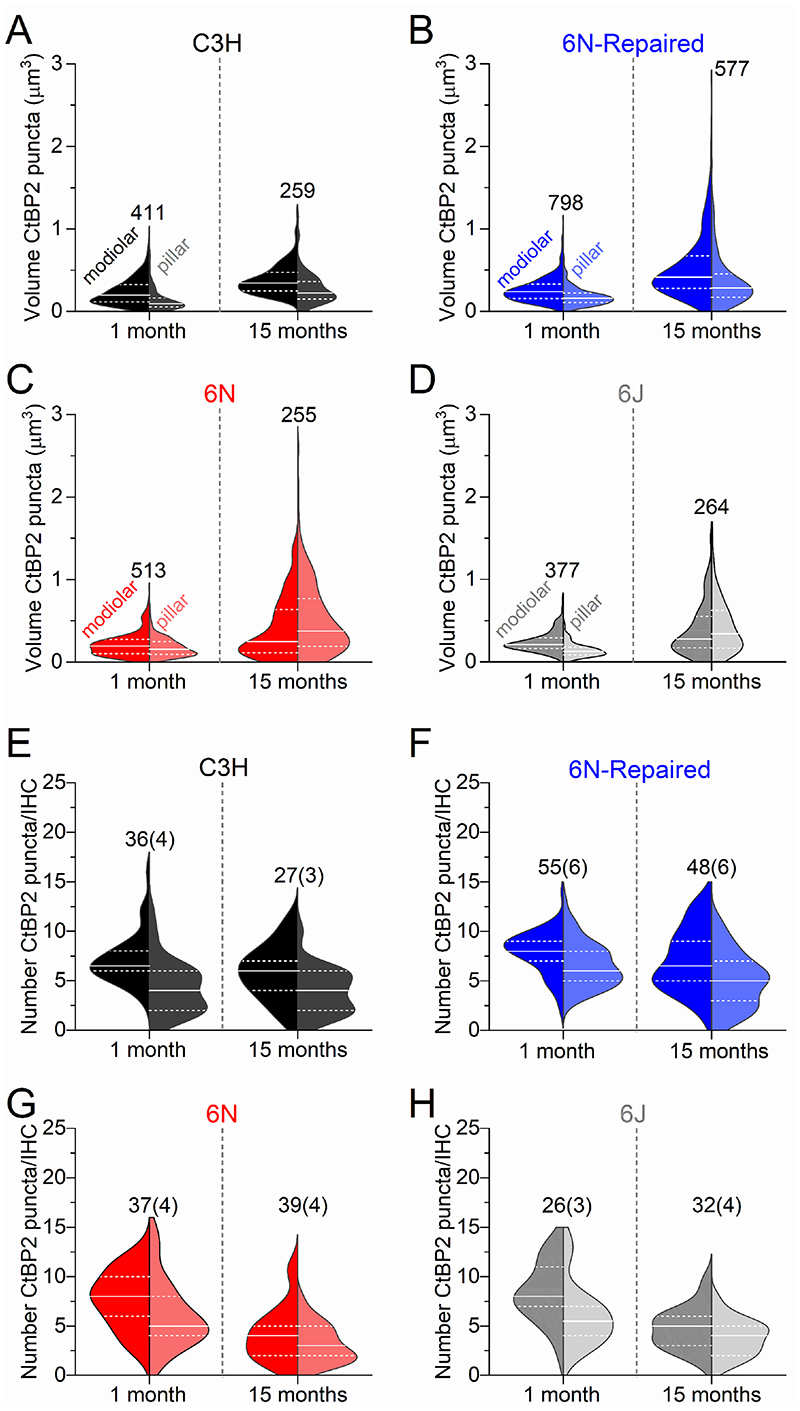
Figure 9. IHC modiolar-pillar gradient in the volume and number of synaptic-ribbons.
A-D, Violin plots comparing the modiolar-pillar distribution of ribbon volume in IHCs from 1 month (left plots) and 15 months (right plots) in C3H (A), 6N-Repaired (B), 6N (C) and 6J (D) mice (see Fig. 7). Both modiolar and pillar side show an increased CtBP2 volume in all mouse strains (P < 0.0001 for all interactions apart between 1 and 15 months; in the pillar side of C3H mice significance was P = 0.0003, Sidak’s post-test, two-way ANOVA). E-H, Violin plot comparing the modiolar-pillar distribution of ribbon number in IHCs from 1 month (left plots) and 15 months (right plots) in C3H (E), 6N-Repaired (F), 6N (G) and 6J (H) mice. The number of ribbons measured are shown above or next to the violin plots in panels A-D, while the number of IHCs (and mice) used is shown above the violin plots in panels E-H.

