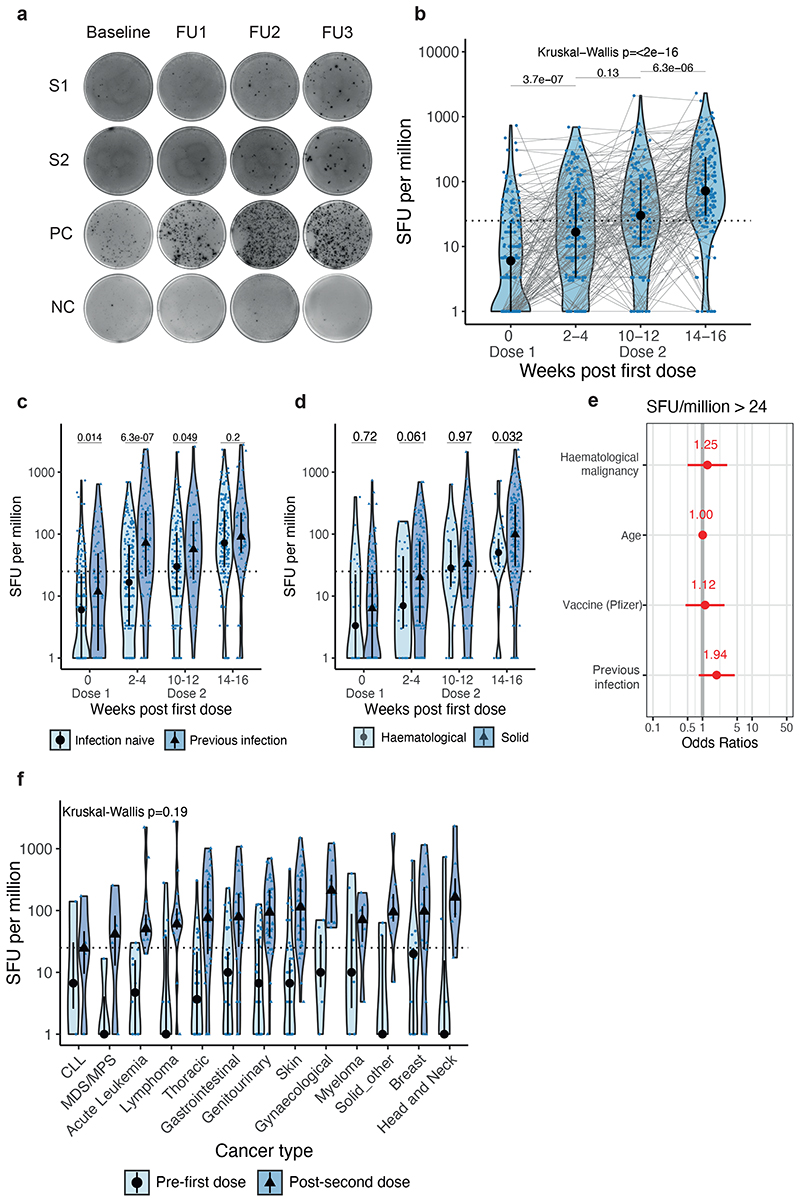
Figure 4. WT SARS-CoV-2-specific T-cell responses in cancer patients following vaccination.
a) Exemplar ELISPOT illustrating WT SARS-CoV-2 specific T-cell response. PBMC were stimulated with 15-mer peptide pools spanning the S1 or S2 subunit of spike. T-cell responses represent the sum of SFU/106 PBMC after stimulation with WT S1 or S2 peptide pools. b) SFU/106 PBMC in infection-naive patients after vaccination (n= 165/195/122/160 patients at BL/FU1/FU2/FU3). Dotted line at <24 denotes the threshold for positivity. Violin plots denote density, PointRange the median and 25 and 75 percentiles. Dots represent individual samples. Samples from individual patients are connected. Significance was tested by Kruskal Wallis test, post-hoc test: two-sided Wilcoxon-Mann-Whitney U test with Bonferroni correction. Only comparisons with the prior timepoint are denoted in the graph. c) Comparison of SFU/106 PBMC in patients with (n= 70/88/49/69 patients at BL/FU1/FU2/FU3) and without prior SARS-CoV-2 infection (n= 165/195/122/160 patients at BL/FU1/FU2/FU3) and in d) patients with solid (n= 136/161/98/130 patients at BL/FU1/FU2/FU3) vs haematological malignancies (n= 29/34/24/30 patients at BL/FU1/FU2/FU3). Violin plots denote density, PointRange the median and 25 and 75 percentiles. Dots represent individual samples. Significance in c-d was tested by two-sided Wilcoxon-Mann-Whitney U test. e) Binary logistic regression of SFU per million PBMCs in patients with solid tumours vs haematological malignancies. Dots denote odds ratio (blue, positive odds ratio red, negative odds ratio); whiskers denote the IQR times 1.5. f) Comparison of SFU per million in patients with haematological malignancies and solid tumours pre-first dose and post-second dose. Dotted line at <24 denotes the lower limit of detection. Violin plots denote density. PointRange denotes the median and the 25 and 75 percentiles. Dots represent individual samples. Significance was tested by Kruskal Wallis test, p < 0.05 was considered significant, post-hoc test: two sided Wilcoxon-Mann-Whitney U test with Bonferroni correction. PBMC, peripheral blood mononuclear cells; NC, negative control; PC, positive control; SFU, spot-forming unit. BL, baseline; FU1, 21-56 days post first-vaccine; FU2, 14-28 days prior to second-vaccine; FU3, 14-28days post second-vaccine.

