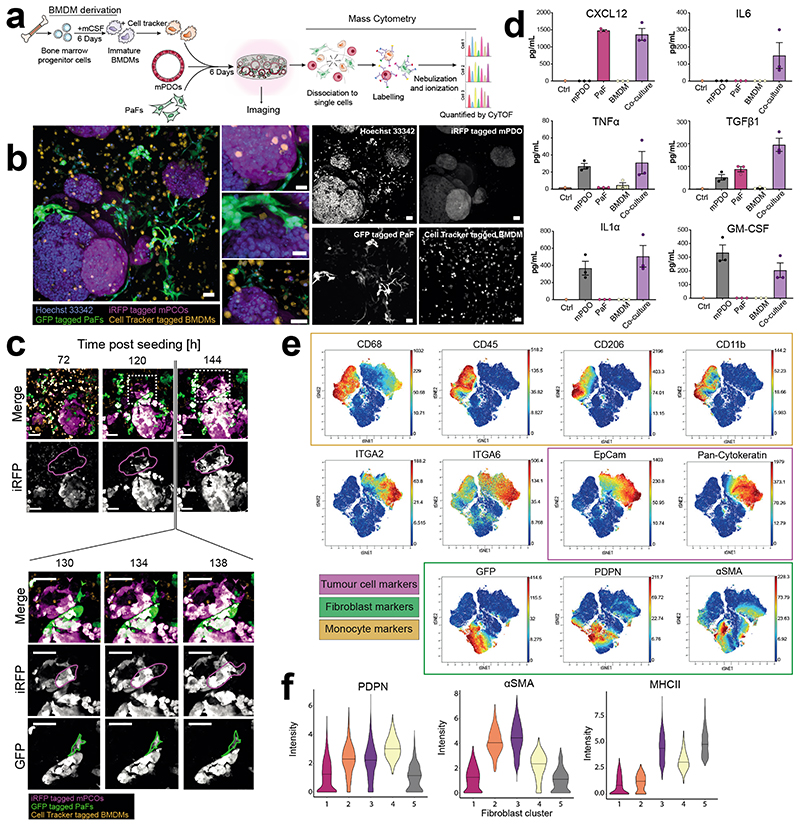
Figure 5. 3D PEG-VS CBF-0.5 gels support stromal co-cultures.
a, Overview of co-culture in PEG-VS CBF-0.5 hydrogels. b, Representative image of co-cultures (d6). Scale bars: 70 μm, images representative of three independent experiments. c, Representative images of co-cultures in 3D PEG-VS CBF-0.5 hydrogels at indicated time after seeding (top) and representative examples of fibroblasts and cancer cells (bottom). Images are representative of at least five individual regions centred around mPCOs. Scale bar: 60 μm. d) ELISA of conditioned medium from mono- and co-cultures grown in PEG-hydrogels for six days (n=3). Error bars: Standard error of mean. e) t-SNE visualisation of mass cytometry analysis of PEG-CBF-0.5 gel co-cultures overlaid with relative quantification of selected markers (d6, n=2). Integrin markers were not used in definition of t-SNE plots. Range of colorimetric scale is indicated for individual markers. f) Violin plots of selected markers for all detected fibroblast clusters. Bold line indicates median intensity of each marker and population.

