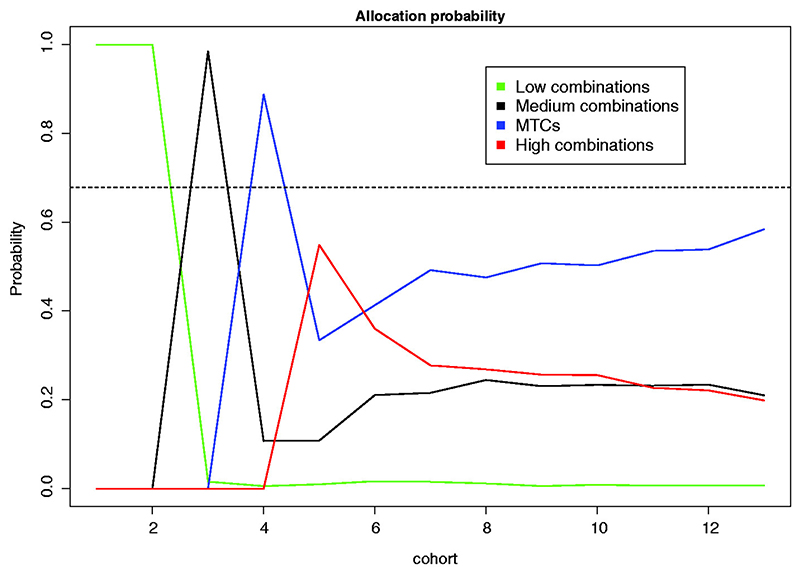
Figure 4.
Allocation probabilities of 12 cohorts to combinations in 2000 replicated trials. The allocation probability for cohort 13 corresponds to the proportion of each group selection as the MTC. The dashed horizontal line corresponds to the proportion of correct selections for the non-parametric optimal benchmark.

