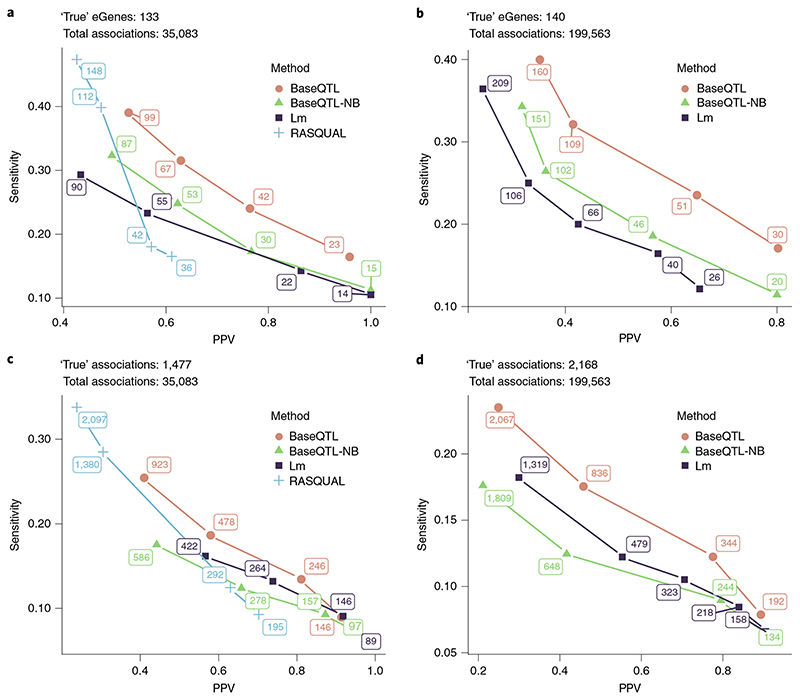
Fig. 3. Benchmarking BaseQTL with observed genotypes.
Analysis was performed with BaseQTL, BaseQTL modeling between-individual signals only (BaseQTL negative binomial (BaseQTL-nB)), a linear model (Lm) and when possible with RASQUAL using a subsample of 86 individuals from the Geuvadis project on genes expressed on chromosome 22. We used a published analysis of 462 individuals from Geuvadis dataset as a gold standard. For each method, significant eQTLs were called for a range of significance thresholds. Then, at each significance threshold, the PPV (the proportion of ‘true’ discoveries relative to all discoveries made by a method) and sensitivity (the proportion of ‘true’ discoveries made by a method relative to the ‘true’ positives in the gold standard) were calculated. eGenes correspond to genes with at least one significant association. For BaseQTL, significance thresholds correspond to different sizes of the posterior credible interval (99%, 95%, 90% and 85%) and we estimated an expected FDR given model assumptions (Methods). For the frequentist methods, we selected a range of FDR that matched the number of discoveries made by BaseQTL (Methods) to compare all methods along a similar range of sensitivity and PPV. Here the expected FDR and the PPV are quantities not mathematically related, as the FDR corresponds to the expected proportion of false discoveries estimated using the discovery data. The number of significant associations or eGenes are shown at each point. a,c, We analyzed 35,083 cis-SNPs within 100 kB of 259 genes (a), of which 1,477 (133 eGenes) (c) were significant in the gold standard. The expected FDRs for all methods were 0.1%, 1%, 5% and 10%. b,d, As in a and c except that a cis-window of 0.5 MB within 264 genes was used covering 199,563 gene–SNP associations (b) of which 2,168 (140 eGenes) (d) were significant in the gold standard. RASQUAL was excluded from the analysis as 54 genes failed to run. The expected FDRs for the Bayesian methods were as in a and c and for the linear model 5%, 10%, 20%, 30% and 50%.

