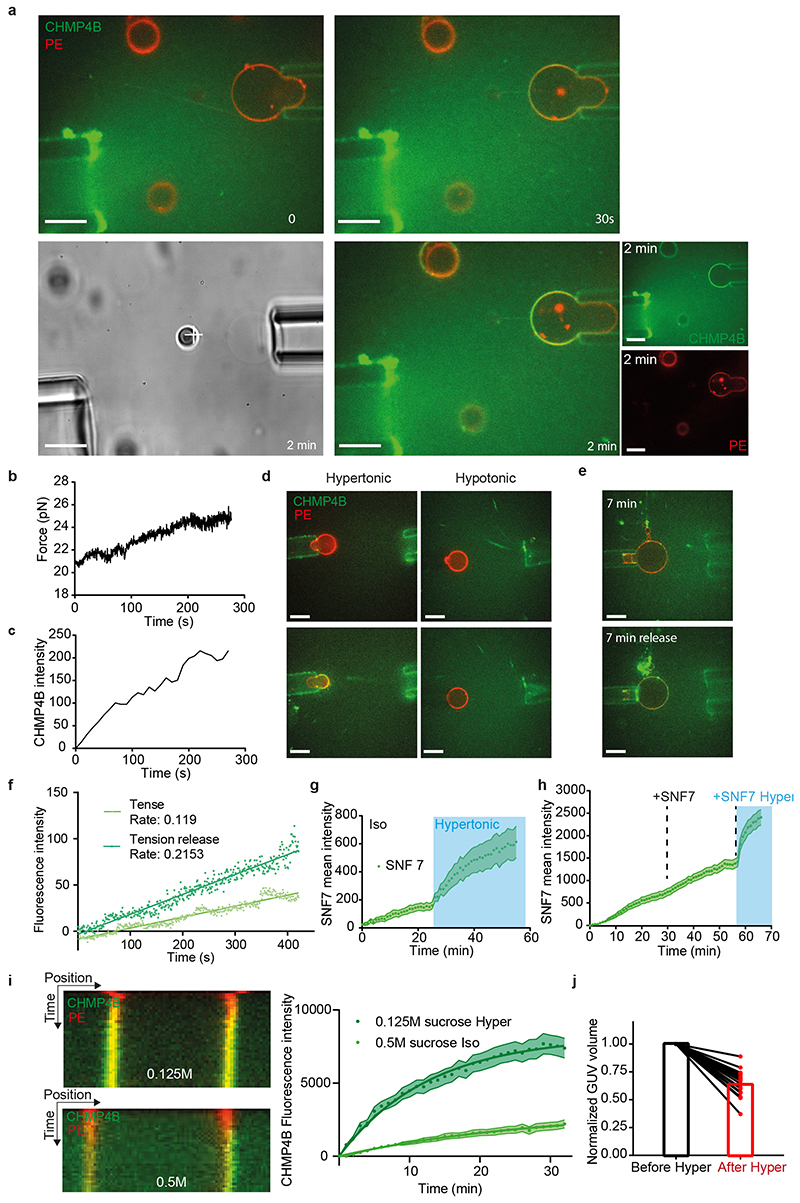
Extended Data Fig. 6. Low membrane tension facilitates CHMP4B association with GUVs (related to Fig 5).
a) Images of a GUV held in the aspiration pipette while purified CHMP4B-A488 is released from the ejection pipette. Binding is clearly visible 2min after CHMP4B ejection. Bars: 10μm. Images representative of 5 experiments. b-c) This example shows that the force exerted on the bead (measured with optical tweezers) increases with time (b), as does CHMP4B binding on the GUV (c), and thus that the force increase is correlated with CHMP4B binding. d) Images of CHMP4B-A488 binding on the GUV surface when the buffer containing CHMP4B is hypertonic or hypotonic. Bars: 10μm. Images representative of 2 experiments. e-f) Tension was released by a decrease in the aspiration of the tongue with the aspiration pipette. In (e), the upper image shows the CHMP4B fluorescence on the GUV 7min after the beginning of protein ejection, and the bottom image 7min after the release of membrane tension (note the disappearance of the tongue). Bars: 10 μm. Images representative of 3 experiments. (f) Quantification of the experiment shown in (e); lines are linear fits. g) Same experiments than in Fig 5c but with Snf7 instead of CHMP4B (at the same concentration). Mean±SEM (N=13 GUVs). h) GUVs were incubated for 30min with 1μm Snf7 in isotonic buffer, and then the solution was replaced with exactly the same solution (+SNF7). Then, at 56min, the solution was replaced again but with hypertonic buffer also containing 1μm Snf7 (+SNF7 Hyper, blue part of the graph). Mean±SEM (N=20 GUVs). i) The upper kymograph shows GUVs containing low (125mM) sucrose, which were then incubated with CHMP4B under hypertonic conditions in the presence of 250 mOsm sucrose; N=44 GUVs. The lower kymograph shows GUVs containing high (500 mM) sucrose, which were incubated with CHMP4B under isotonic conditions in the same buffer (500 mM sucrose); N=54 GUVs. The mean intensity of CHMP4B-Alexa488 on the bilayer over time is shown in the right panel; binding rate is 1/τ= 0.07837 for 125mM sucrose, and 1/τ= 0.03522 for high sucrose, as indicated. Mean±SEM. j) Volumes of single GUV before (black) and after a 10min hypertonic shock (red) (N=20 GUVs, bars represent the mean)

