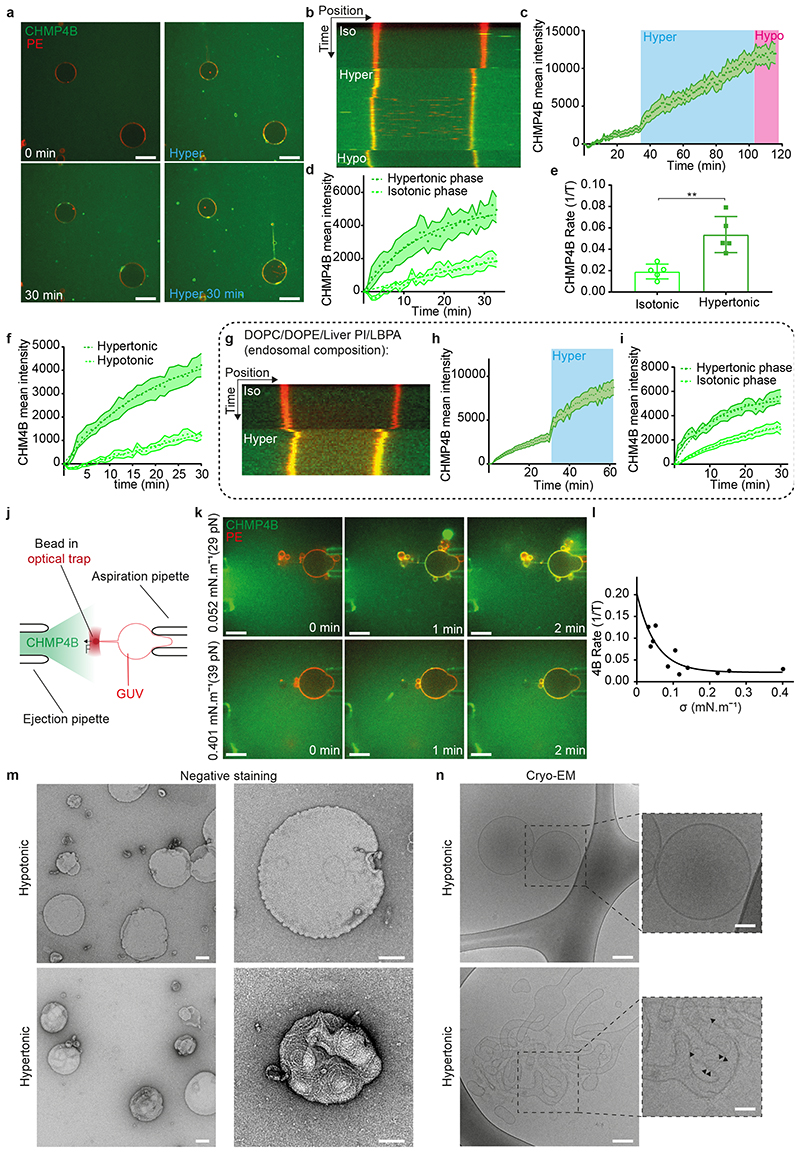
Figure 5. A decrease in membrane tension increases CHMP4B polymerisation rate in vitro.
a) Time-lapse confocal images rhodamine-PE labelled GUVs (red) were mixed (0min) with 1 μM CHMP4B-Alexa488 (green), and incubated first in isotonic (250mOsm, 0-30min, white captions) and then in hypertonic (500 mOsm, 0-30min, blue captions) solutions. Image representative of 5 experiments. Bars: 20 μm. b-c) Following experiment shown in (a), GUVs were switched to a hypotonic solution (200 mOsm) for 15min. b) shows a kymograph (representative of 5 experiments) and c) the mean intensity of CHMP4B on the bilayer over time; shaded area: SEM (N=13 GUVs). d) CHMP4B-Alexa488 mean intensity with time on the GUV and their exponential fit during isotonic and hypertonic phases extracted from (c). e) Binding rates extracted from single exponential fits to data as shown in d) (N=5). Each point represents a single experiment, for which 3-13 GUVs were analysed. (two-tailed paired t-test: P=0.0021). f) CHMP4B-Alexa488 mean intensity on GUVs under hypotonic (N=10 GUVs) and hypertonic conditions (N=8 GUVs) ; shaded area: SEM. Binding rates are: hypotonic, 1/τ=0.0053 (±0.009150) s-1; hypertonic, 1/τ=0.05067 (±0.004313) s-1. g) Kymograph (representative of 4 experiments) of the same experiments as in (a) but with the indicated lipid composition (DOPC:DOPE:LiverPI:LBPA, [5:2:1:2]). h) Mean intensity of CHMP4B-Alexa488 on the bilayer over time; shaded area: SEM (N=44 GUVs in 4 experiments). i) CHMP4B-Alexa488 mean intensity with time on the GUV and their exponential fit during isotonic and hypertonic phases extracted from (h). Binding rates are: Isotonic, 1/τ=0.03111 (±0.002583) s-1; hypertonic, 1/τ=0.1014 (±0.009605) s-1. Shaded area: SEM (N=44 GUVs in 4 experiments) j) Schematic representation of the tube pulling setup used in this study. k) The membrane tension of Rhod-PE GUVs (red) was adjusted using a micropipette, and measured by pulling a membrane tube with optical tweezers, while an isotonic solution containing CHMP4B (green) was injected (see also Extended Data Fig.6). Time-lapse confocal images show CHMP4B membrane association at low (upper panel), and high membrane tension (lower panel). Image representative of 10 experiments. Bars: 10 μm l) CHMP4B binding rates (1/τ) plotted against membrane tension, as obtained from several GUVs (one per dot). A single exponential decay (black curve) was fitted (R2=0.76). m) Negative stain electron micrographs of LUVs incubated with 1μM CHMP4B for 2h in a hypotonic (upper panels) or hypertonic solution (lower panels) at low (left panels) and high (right panels) magnification (Bars: 100 nm). Image representative of 2 experiments. Bars: 100 nm. n) Cryo-electron micrographs of LUVs in hypotonic and hypertonic conditions: CHMP4B filaments can be observed under hypertonic conditions (black arrowheads). Bars: left panels, 50 nm; right panels: 25 nm. Image representative of 2 experiments.

