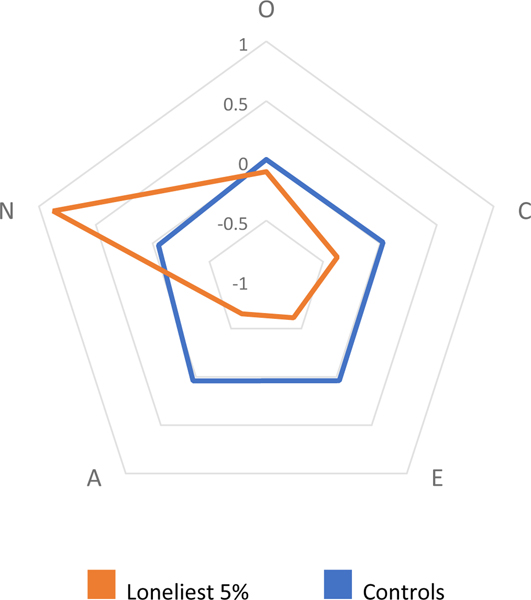
Figure 1.
Radar chart of perceived Big Five personality scores in the loneliest 5% of participants (N = 108) versus ‘controls’ (the remaining 95% of participants; N = 1,936). The corners of the polygonal shapes indicate the mean scores in the two groups for each of the fives scales. The scales have been z-scored, such that the midpoint of the axes (0) reflects the overall sample means for each trait, and the axis ranges from 1 standard deviation below the mean to 1 standard deviation above. Scores nearer the centre of the figure are lower than the mean; scores further to the edges are higher. O = Openness to experience. C = Conscientiousness. E = Extraversion. A = Agreeableness. N = Neuroticism.

