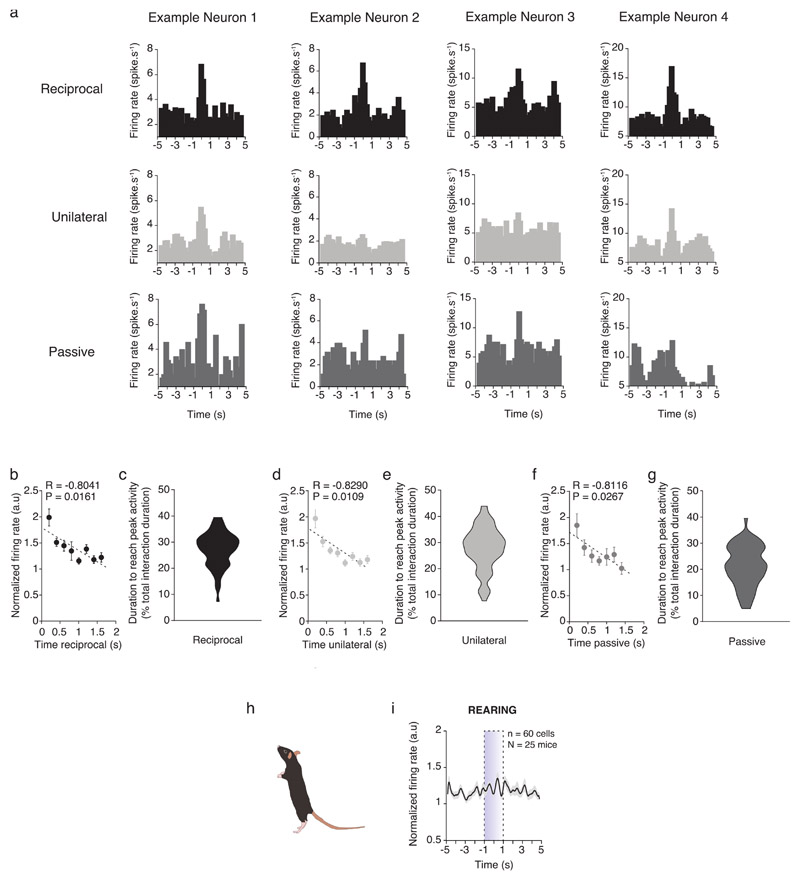
Extended Data Fig. 2. The VTA DA activity increases at the initiation of interaction events and rearing behavior does not induce VTA DA changes.
(a) Examples of neurons responding to reciprocal, unilateral and passive contacts. Neurons 1 and 2 are from the same animal while Neuron 3 and 4 are from another same animal. In these examples we can see the heterogeneity of neuronal activity depending on contacts for a same neuron or animal. (b) Normalized VTA DA activity in function of the duration of bouts of reciprocal interaction with a bin of 200ms. The initiation of the interaction seems to induce the highest increase of VTA DA activity. Pearson’s coefficient correlation twosided. (c) Distribution of the duration to reach the peak of VTA DA activity during interactions (normalized in percentage of bouts duration). Mean = 27.25%, s.e.m = 0.853%. (d) Normalized VTA DA activity in function of the duration of bouts of unilateral interaction with a bin of 200ms. Pearson’s coefficient correlation two-sided. (e) Distribution of the duration to reach the peak of VTA DA activity during interactions (normalized in percentage of bouts duration). Mean = 27.63%, s.e.m = 1.057%. (f) Normalized VTA DA activity in function of the duration of bouts of passive interaction with a bin of 200ms. Pearson’s coefficient correlation two-sided. (g) Distribution of the duration to reach the peak of VTA DA activity during interactions (normalized in percentage of bouts duration). Mean = 21.47%, s.e.m = 0.995%. (h) Schema of rearing behavior. (i) PETH of the normalized VTA DA activity centered on the rearing behavior 5 seconds before and after the rearing. The rearing behavior does not induce changes at VTA DA activity population level.
N, n indicate the number of mice and cells respectively. All the data are shown as the mean +/-s.e.m. as error bars.

