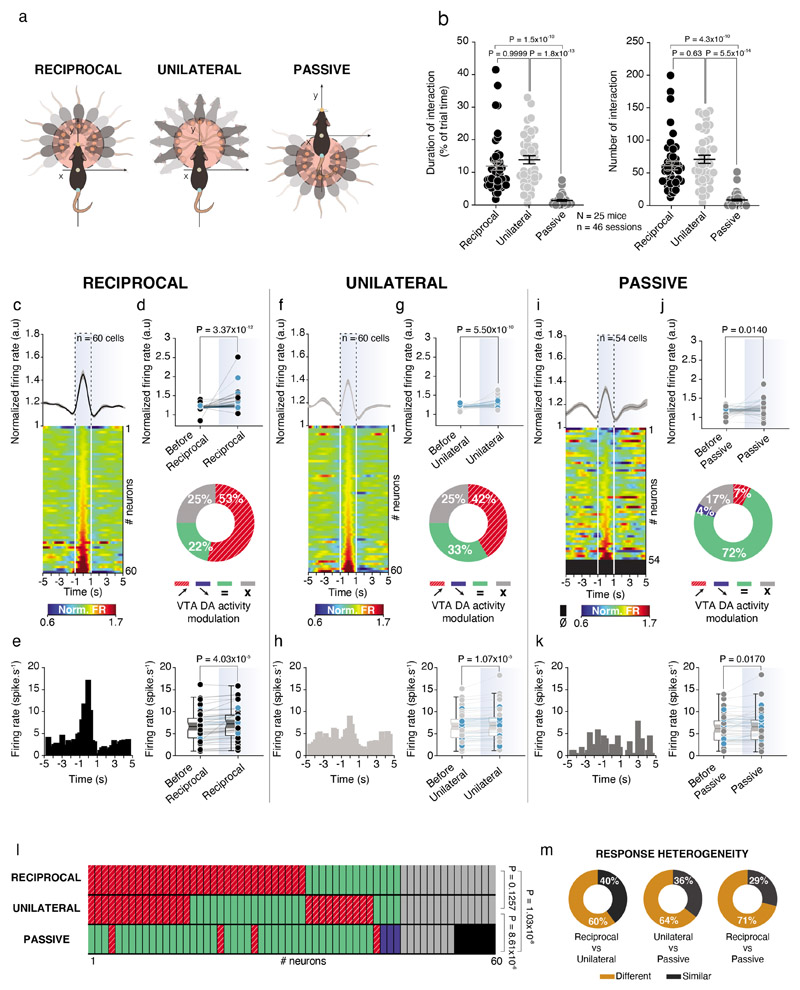
Figure 2. VTA DA neurons activity increases during social interactions with high heterogeneity response.
(a) Schema of the analyses to obtain reciprocal (Left), unilateral (Middle) and passive (Right) interactions. (b) Left: Time spent in reciprocal, unilateral and passive interactions for the experimental mouse. Friedman test two-sided (χ2 (46) = 66.91, P = 3x10-15), followed by Dunn’s test. Right: Number of contacts in reciprocal, unilateral and passive interactions for the experimental mouse. Friedman test two-sided (χ2 (46) = 67.97, P = 2x10-15), followed by Dunn’s test. (c) Top: Normalized VTA DA firing rate during reciprocal interaction with the Peri-Event Time Histogram (PETH) centered on the reciprocal contacts 5s before and after. Down: Associated heatmap of each neuron recorded classify in ascending order. (d) Top: Normalized VTA DA firing rate before and during reciprocal interaction. Blue dots represent photolabeled neurons (n = 17). Wilcoxon test twosided (W = 1652). Down: Proportion of the different VTA DA neurons activity responses during reciprocal events (red/stripes, increasing; blue, decreasing; green, no activity changes for a given interaction; grey, no activity changes independently the type of interaction). (e) Left: PETH of one example neuron during reciprocal interaction showing an increase. Right: Firing rate of VTA DA neurons before and during reciprocal interaction. Blue dots represent photolabeled neurons (n = 17). Paired t-test two-sided (t(59) = 4.438). (f) Top: Normalized VTA DA firing rate during unilateral interaction with the PETH centered on the unilateral contacts 5s before and after. Down: Associated heatmap of each neuron recorded classify in ascending order. (g) Top: Normalized VTA DA firing rate before and during unilateral interaction. Blue dots represent photolabeled neurons (n = 17). Wilcoxon test two-sided (W = 1524). Down: Proportion of the different VTA DA neurons activity responses during unilateral events. (h) Left: PETH of the same example neuron than in (e) during unilateral interaction showing small increase. Right: Firing rate of VTA DA neurons before and during unilateral interaction. Blue dots represent photolabeled neurons (n = 17). Paired t-test two-sided (t(59) = 4.812). (i) Top: Normalized VTA DA firing rate during passive interaction with the PETH centered on the passive contact 5s before and after. Down: Associated heatmap of each neuron classify in ascending order. (j) Top: Normalized VTA DA activity before and during passive interaction. Blue dots represent photolabeled neurons (n = 17). Wilcoxon test two-sided (W = 567). Down: Proportion of the different VTA DA neurons activity responses in passive interaction. (k) Left: PETH of the same neuron than in (e) and (h) during passive interaction not showing any changes in activity. Right: Firing rate of VTA DA neurons before and during passive interaction. Blue dots represent photolabeled neurons (n = 17). Wilcoxon test two-sided (W = 551). (l) Activity changes of the same VTA DA neurons depending on the type of interaction between reciprocal, unilateral and passive. Chi-square test two-sided between ratio of responses type for each interaction (Overall: χ2 (4) = 39.97, P = 4.39x10⁻⁸; Reciprocal vs unilateral: χ2 (1) = 2.344; Reciprocal vs passive: χ2 (2) = 36.78; Unilateral vs passive: χ2 (2) = 23.33). (m) Response heterogeneity of VTA DA neurons between reciprocal, unilateral and passive interactions in the neurons responding to at least one type of interaction. The neurons show either different or similar responses to the different contacts.
N, n indicate the number of mice and cells respectively (except for (b) where n indicates sessions). For box plots: the center line represents the median, the bounds of the box the 25th to 75th percentile interval and the whiskers the minima and maxima. Dots represent individual data points. All the data, except box plots, are shown as the mean +/- s.e.m. as error bars.

