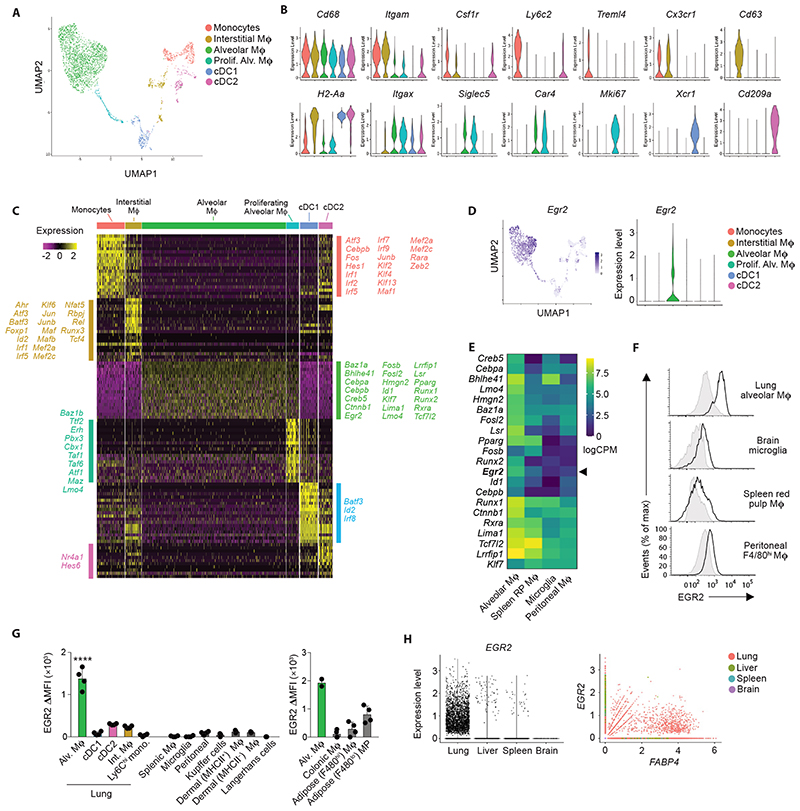
Figure 1. EGR2 expression is a selective property of alveolar macrophages.
A. UMAP dimensionality reduction analysis of 3936 cells (non-granulocyte, myeloid cells) reveals six clusters of mononuclear phagocytes in murine lungs. Cells obtained from an individual Rag1 –/– mouse.
B. Feature plots displaying expression of individual genes by clusters identified in A.
C. Heatmap showing the top 20 most differentially expressed genes by each cluster defined in A. and annotated to show upregulated transcription factors/regulators within each cluster.
D. Overlay UMAP plot and feature plot showing expression of Egr2 by clusters identified in A.
E. Heatmap showing relative expression of selected transcription factors by lung alveolar macrophages, CD102+ peritoneal macrophages, brain microglia and red pulp splenic macrophages as derived from the ImmGen consortium.
F. Representative expression of EGR2 by lung alveolar macrophages, CD102+ peritoneal macrophages, brain microglia and red pulp splenic macrophages obtained from adult unmanipulated C57BL/6 mice. Shaded histograms represent isotype controls. Data are from one of three independent experiments.
G. Expression of EGR2 by the indicated macrophage and myeloid cell populations shown as relative MFI (MFI in Egr2 fl/fl – MFI in Lyz2 Cre/+.Egr2 fl/fl mice). Adipose & colonic macrophages shown on a separate graph due to measurements performed in an independent experiment with different flow cytometer settings. Repeat data for alveolar macrophages included as a reference. Data represent 3-4 mice (left graph) or 2-4 mice (right graph) per tissue. **** p<0.0001 (One-way ANOVA followed by Tukey’s multiple comparisons post-test).
H. In silico analysis of EGR2 and FABP4 expression by lung, liver, spleen and brain macrophages extracted on the basis of C1QA+ expression from (17–19).

