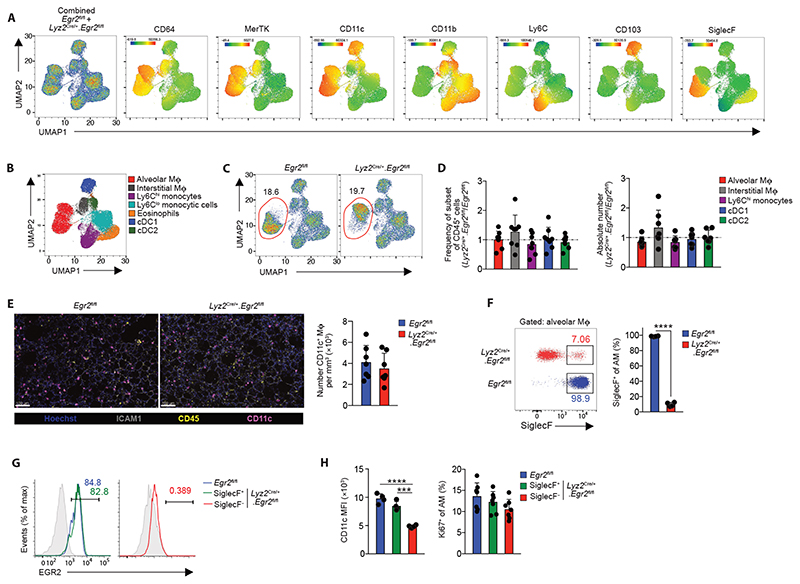
Figure 2. EGR2 is required for the phenotypic identity of alveolar macrophages.
A. UMAP analysis of CD3–CD19–NK1.1–Ly6G–CD11b+/CD11c+ cells pooled from adult unmanipulated Egr2 fl/fl and Lyz2 Cre/+.Egr2 fl/fl mice (left panel). Heatmap plots showing the relative expression of the indicated markers by myeloid clusters.
B. Cluster identity confirmed by manual gating (see Fig. S3A).
C. Relative frequency of alveolar macrophages of all CD45+ leukocytes in unmanipulated adult Egr2 fl/fl and Lyz2 Cre/+.Egr2 fl/fl mice.
D. Relative frequency and absolute number of alveolar macrophages, cDC1, cDC2, Ly6Chi monocytes and CD64+MHCII+ interstitial macrophages in lung digests from adult unmanipulated Lyz2 Cre/+.Egr2 fl/fl mice compared with their abundance in Egr2 fl/fl littermates. Data are pooled from three independent experiments with 8 mice per group.
E. Confocal fluorescence imaging of Fixed Precision Cut Lung Slices from adult unmanipulated Egr2 fl/fl or Lyz2 Cre/+.Egr2 fl/fl mice stained with antibodies against ICAM1, CD45 and CD11c (left) and quantification of the number of CD11c+ macrophages per mm3 in each group (right). Data are pooled from three independent experiments with 7 mice per group.
F. Representative expression of SiglecF by CD11chiCD11blo alveolar macrophages (from F) obtained from lung digests from adult unmanipulated Egr2 fl/fl or Lyz2 Cre/+.Egr2 fl/fl mice (left), frequency of SiglecF+ macrophages in each strain (right). Data are from 4 mice per group from one of at least 5 independent experiments. SiglecF; ****p<0.0001 (unpaired Student’s t-test).
G. Representative expression of EGR2 by SiglecF-defined alveolar macrophages. Shaded histograms represent isotype controls. Data are from one of three independent experiments.
H. Mean fluorescence intensity (MFI) of CD11c expression (left) and frequency of Ki67+ SiglecF-defined CD11chiCD11blo alveolar macrophages (right) amongst lung digests from adult unmanipulated Egr2 fl/fl and Lyz2 Cre/+.Egr2 fl/fl mice. Data are from 4 mice per group from one of at least 5 independent experiments. *** p<0.001, **** p<0.0001 (One-way ANOVA followed by Tukey’s multiple comparisons post-test).
Symbols represent individual mice in all graphs and error bars represent the standard deviation.

