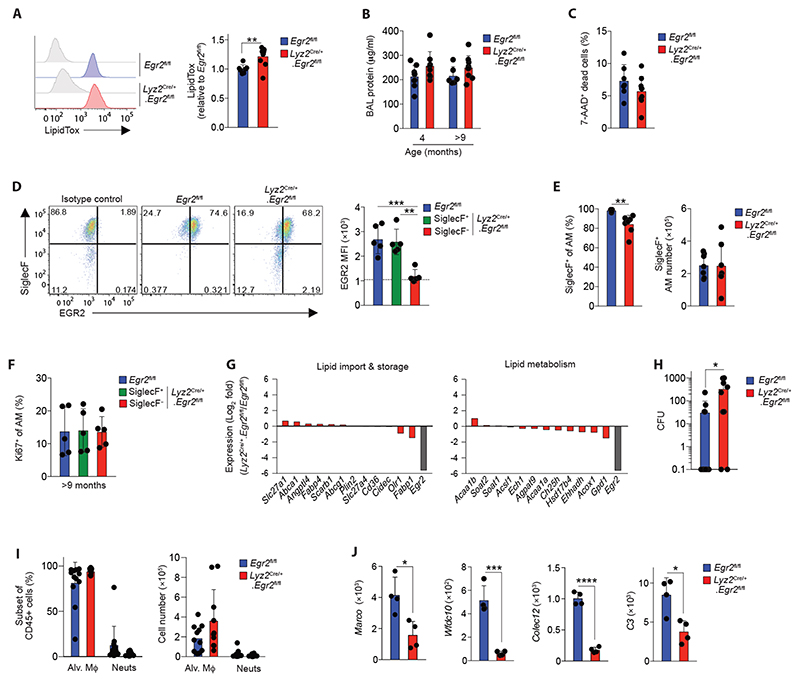
Figure 4. EGR2 controls distinct functional characteristics of alveolar macrophages.
A. Representative LipidTox staining of alveolar macrophages from the BAL fluid of unmanipulated adult Egr2 fl/fl or Lyz2 Cre/+.Egr2 fl/fl mice (left). Graph shows the mean fluorescence intensity (MFI) of LipidTox in alveolar macrophages from Lyz2 Cre/+.Egr2 fl/fl mice relative to those from Egr2 fl/fl mice. Data are from 7 (Egr2 fl/fl) and 10 (Lyz2 Cre/+.Egr2 fl/fl) mice per group pooled from three independent experiments. **p<0.01 (unpaired Student’s t-test).
B. Protein levels in the BAL fluid of Egr2 fl/fl or Lyz2 Cre/+.Egr2 fl/fl mice at 4 or 9-12 months of age. Data are from 6-9 mice per group pooled from two independent cohorts of aged mice.
C. Frequency of 7-AAD+ (dead) cells in the BAL fluid of Egr2 fl/fl or Lyz2 Cre/+.Egr2 fl/fl mice at 9-12 months of age. Data are from 6-9 mice per group pooled from two independent cohorts of aged mice.
D. Representative expression of SiglecF and EGR2 by CD11chiCD11blo macrophages and MFI of EGR2 by SiglecF-defined CD11chiCD11blo macrophages obtained from 11-12 month old Egr2 fl/fl or Lyz2 Cre/+.Egr2 fl/fl mice. Data are from 5 mice per group pooled from two independent cohorts of aged mice. ** p<0.01, *** p<0.001 (One-way ANOVA followed by Tukey’s multiple comparisons post-test.)
E. Frequency (left) and absolute number (right) of SiglecF+ cells amongst CD11chiCD11blo macrophages obtained from 11-12 month old Egr2 fl/fl or Lyz2 Cre/+.Egr2 fl/fl mice. Data are from 7 mice per group pooled from three independent cohorts of aged mice. **p<0.01 (unpaired Student’s t-test).
F. Frequency of Ki67+ cells amongst SiglecF-defined CD11chiCD11blo macrophages obtained from 11-12 month old Egr2 fl/fl or Lyz2 Cre/+.Egr2 fl/fl mice. Data are from 5 mice per group pooled from two independent experiments.
G. Log2-fold expression of genes that are implicated in lipid uptake or metabolism in alveolar macrophages as defined by (8). Expression of Egr2 is included as a reference.
H. Bacterial levels (colony forming units, CFU) in the BAL fluid of Egr2 fl/fl or Lyz2 Cre/+.Egr2 fl/fl mice 14hrs after infection. Data are from 10 (Lyz2 Cre/+.Egr2 fl/fl) or 12 (Egr2 fl/fl) mice per group pooled from three independent experiments. *p<0.05 (Mann Whitney test).
I. Frequency (left) and absolute number (right) of CD11chiCD11blo alveolar macrophages and Ly6G+ neutrophils in the BAL fluid of Egr2 fl/fl or Lyz2 Cre/+.Egr2 fl/fl mice 14hrs after infection. Data represent 10 (Lyz2 Cre/+.Egr2 fl/fl) or 11 (Egr2 fl/fl) mice per group pooled from three independent experiments.
J. Expression of Marco, Wfdc10, Colec12 and C3 from the RNA-seq dataset (left panels). *p<0.05, ***p<0.001, ****p<0.0001 (unpaired Student’s t-test).
Symbols represent individual mice in all graphs and error bars represent the standard deviation.

