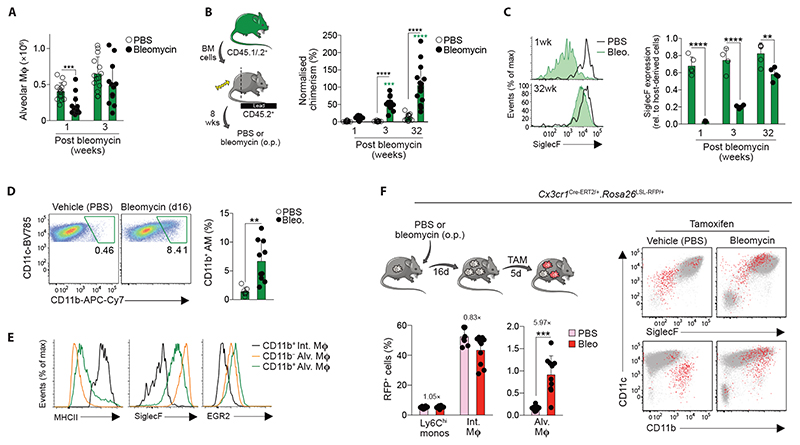
Figure 7. Monocyte-derived, CX3CR1+ parenchymal macrophages can replenish the alveolar macrophage niche following injury.
A. Absolute numbers of alveolar macrophages 1- and 3-weeks following bleomycin administration or PBS vehicle control. Data are pooled from two independent experiments at each time point with 13-15 mice per group. ***p<0.001 (unpaired Student’s t test with Holm-Sidak correction).
B. Non-host chimerism of alveolar macrophages in tissue protected bone marrow chimeric mice at 1-, 3- or 32-weeks following administration of bleomycin or PBS vehicle control. Chimerism is normalised to Ly6Chi blood monocytes. Data are pooled from two independent experiments at each time point with 13-15 mice per group. ***p<0.001, ****p<0.0001 (Two-way ANOVA with Tukey’s multiple comparisons test)
C. Expression of SiglecF by CD11chiCD11blo alveolar macrophages from the lung of mice in B. at 1 week and 32 weeks post bleomycin or PBS administration. Data are from one of two independent experiments at each time point with 4 mice per group. ***p<0.001, ****p<0.0001 (Two-way ANOVA with Tukey’s multiple comparisons test).
D. Representative expression of CD11c and CD11b by CD11chiCD64+ cells obtained by BAL from WT mice two weeks after instillation of bleomycin or vehicle control (left). Graph shows the mean frequency of CD11b+ alveolar macrophages (right). Data are pooled from two independent experiments with 7 (PBS) or 10 (bleomycin) mice per group. **p<0.01 (unpaired Student’s t test).
E. Representative expression of MHCII, SiglecF and EGR2 by CD11b+ interstitial macrophages and CD11b-defined CD11chi alveolar macrophages.
F. Experimental scheme for the induction of lung injury and tamoxifen administration in Cx3cr1 Cre-ERT2/+.Rosa26 LSL-RFP/+ fate mapping mice. Lower graphs show the levels of recombination in Ly6Chi monocytes, CD64+ interstitial macrophages and alveolar macrophages from Cx3cr1 Cre-ERT2/+.Rosa26 LSL-RFP/+ mice administered bleomycin or vehicle control. Representative expression of CD11c, SiglecF and CD11b by RFP+ (red) or RFP– (grey) cells present in the BAL fluid of Cx3cr1 Cre-ERT2/+.Rosa26 LSL-RFP/+ mice 3 weeks after bleomycin or vehicle instillation. Graphs show the mean fluorescent intensity (MFI) of CD11c and SiglecF expression by RFP+ cells.
Symbols represent individual mice in all graphs and error bars represent the standard deviation.

