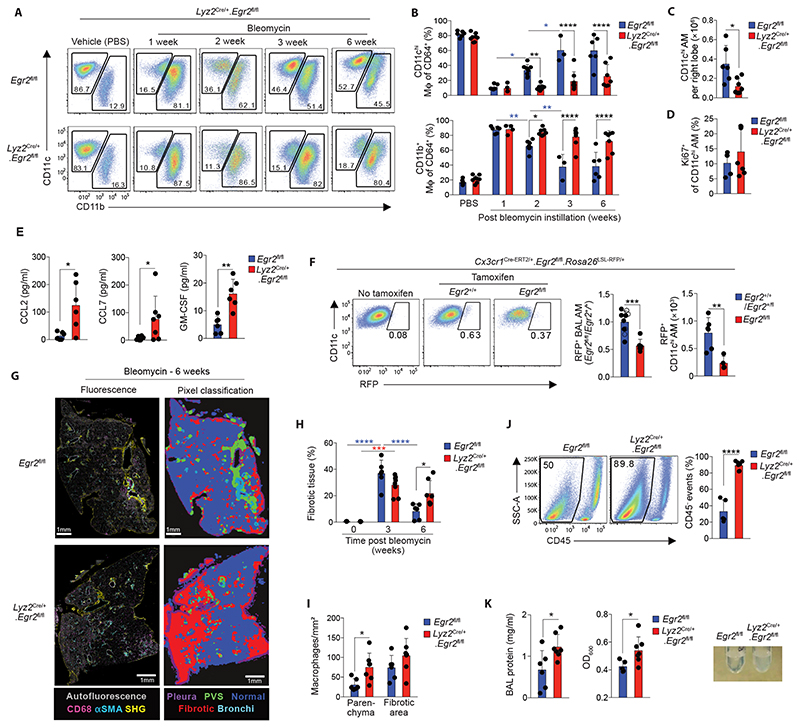
Figure 8. EGR2 is indispensable for the repopulation of the alveolar macrophage niche and tissue repair following lung injury.
A. Representative expression of CD11c and CD11b by live CD45+CD3–CD19–Ly6G–CD64+ cells from the lungs of Egr2 fl/fl and Lyz2 Cre/+.Egr2 fl/fl mice at 1, 2, 3 or 6 weeks post bleomycin or vehicle controls.
B. Frequency of CD11chiCD11blo alveolar macrophages and CD11cvarCD11b+ cells from mice in A. Data are pooled from at least two independent experiments at each time point with 3-7 mice per group. *p<0.05. **p<0.01, p<0.001, ****p<0.0001 (Two-way ANOVA with Tukey’s multiple comparisons test).
C. Absolute number of CD11chiCD11blo alveolar macrophages in lungs six weeks post bleomycin instillation. Data are pooled from two independent experiments with 6 (Egr2 fl/fl) or 7 (Lyz2 Cre/+.Egr2 fl/fl) mice per group. *p<0.05 (Mann Whitney test).
D. Frequency of Ki67+ CD11chiCD11blo alveolar macrophages in lungs six weeks post bleomycin instillation. Symbols represent individual mice. Data are pooled from two independent experiments with 6 (Egr2 fl/fl) or 7 (Lyz2 Cre/+.Egr2 fl/fl) mice per group.
E. CCL2, CCL7 and GM-CSF levels in BAL fluid obtained from Egr2 fl/fl and Lyz2 Cre/+.Egr2 fl/fl mice six weeks post bleomycin instillation. Data are pooled from two independent experiments with 6 mice per group. *p<0.05, Mann Whitney test (CCL2, CCL7), **p<0.01 (unpaired Student’s t test; GM-CSF).
F. Representative expression of RFP by CD11chiCD64+ alveolar macrophages present in the BAL fluid of Cx3cr1 Cre-ERT2/+.Rosa26 LSL-RFP/+.Egr2 fl/fl and their Cx3cr1 Cre-ERT2/+.Rosa26 LSL-RFP/+.Egr2 +/+ (open circles) or Cx3cr1 Cre-ERT2/+.Rosa26 LSL-RFP/+.Egr2 fl/+ (solid circles) controls 3 weeks following instillation of bleomycin or vehicle control. Graphs show the relative frequency (left) or absolute number (right) of RFP+ alveolar macrophages present in the BAL fluid. Data are from one experiment of two (number) with 6 (Egr2 +/+ [open symbols]/Egr2 fl/+ [filled symbols]) or 4 mice (Egr2 fl/fl) per group, or pooled from two independent experiments (frequency) at each time point with 10 (Egr2 +/+ [open symbols]/Egr2 fl/+ [filled symbols]) or 6 (Egr2 fl/fl) per group. ** p<0.01, ***p<0.001 (Unpaired Student’s t test).
G. 2-photon fluorescence imaging of lung tissue from adult Egr2 fl/fl and Lyz2 Cre/+.Egr2 fl/fl mice 6 weeks following bleomycin administration. Sections were stained with CD68, aSMA and DAPI. Autofluorescence is depicted in grey and collagen was detected by second harmonic generation (SHG). Pixel classification was used to segment lung regions of interest: (1) normal lung parenchyma/alveolar tissue, (2) pathologic/fibrotic tissue and (3) collagen rich areas (perivascular/bronchial spaces and pleura) were segmented to avoid false fibrotic region detection.
H. Quantification of fibrotic score of lung tissue from Egr2 fl/fl and Lyz2 Cre/+.Egr2 fl/fl 3 or 6 weeks following bleomycin administration or PBS controls (from 3 week time point). See Fig. S10. Data are pooled from two independent experiments with 6 (Egr2 fl/fl) or 7 (Lyz2 Cre/+.Egr2 fl/fl) mice per group. *p<0.05, **p<0.01, ***p<0.001, ****p<0.0001 (Two-way ANOVA followed by Tukey’s multiple comparisons test).
I. Quantification of macrophage density in the parenchyma and fibrotic areas of lung tissue from Egr2 fl/fl and Lyz2 Cre/+.Egr2 fl/fl 6 weeks following bleomycin administration. See Fig. S10. Data are pooled from two independent experiments with 6 (Egr2 fl/fl) or 7 (Lyz2 Cre/+.Egr2 fl/fl) mice per group. *p<0.05 (Student’s t test with Holm-Sidak correction for multiple tests).
J. SSC-A profile and expression of CD45 by BAL obtained from Egr2 fl/fl and Lyz2 Cre/+.Egr2 fl/fl 6 weeks following bleomycin administration. Graph shows the mean frequency of CD45+ cells amongst all live, single events. Symbols represent individual mice. Data are pooled from two independent experiments with 5 (Egr2 fl/fl) or 7 (Lyz2 Cre/+.Egr2 fl/fl) mice per group. ****p<0.0001 (unpaired Student’s t test).
K. Total protein concentration (left), turbidity (centre) and representative pictures (right) of BAL fluid from Egr2 fl/fl and Lyz2 Cre/+.Egr2 fl/fl 6 weeks following bleomycin administration. Symbols represent individual mice. Data are pooled from two independent experiments with 6 (Egr2 fl/fl) or 7 (Lyz2 Cre/+.Egr2 fl/fl) mice per group. *p<0.05 (Mann Whitney test).
Symbols represent individual mice in all graphs and error bars represent the standard deviation.

